Sizing a container takes two numbers: how much it normally uses, for the request, and how much it reaches at its worst moment, for the limit’s headroom. KubeBolt gives you both. Right-sizing computes the first, and each workload’s Monitor tab shows the second.
Up to 2.5, each one failed in a specific case. The 7-day chart didn’t draw short spikes, and right-sizing on a freshly connected cluster proposed taking everything down almost to zero. Here’s what was happening, how to read them now and how I use them to size containers. If you only want to know what 2.6 brings:
- CPU and memory charts draw each interval’s peak from the 6-hour range up, and their “max” is the true max.
- Kobi reads the same peaks as the chart and tells you when the max happened.
- Right-sizing recommends nothing until it has two days of history.
- Every pod’s network traffic is counted once. To stop the agent sending the copy, upgrade it to 1.4.8.
- The Pods tab pages 50 at a time, and the Bursts tab shows the cluster you have open.
What a long chart didn’t draw
A chart draws one point per interval. On the 7-day range there’s one point per hour, and up to 2.5 that point was the value at the end of the hour. Whatever happened in between never reached the chart.
One hour of the pod's memory, minute by minute
Up to 2.5
The hour's point was its last value: 0.29 GiB
Since 2.6
The hour's point is its peak: 2.9 GiB
- The agent sends the pod’s memory every few seconds, and during that hour it spent six minutes at 2.9 GiB.
- 2.5’s chart took the hour’s last value, 0.29 GiB, and the panel’s “max” repeated that number.
- 2.6’s chart searches the hour minute by minute for its highest value and draws that.
It happens on every range whose interval is longer than a minute:
| Range | One point every | What it draws since 2.6 |
|---|---|---|
| 5 min, 15 min, 1 h | 15 or 30 s | Every sample, as before |
| 6 h | 2 min | The peak of those 2 minutes |
| 24 h | 10 min | The peak of those 10 minutes |
| 7 days | 1 h | The hour’s peak |
| 14 days | 2 h | The peak of those 2 hours |
| 30 days | 6 h | The peak of those 6 hours |
On the 30-day range, a six-minute spike had a one-in-sixty chance of landing on the instant that got drawn. This applies to the CPU and memory of pods, workloads and nodes. Network isn’t peaked: each point is still the rate over its window, so a short burst between two points doesn’t show.
Since the points are peaks, the numbers beside the chart change names:
maxis the range’s true max.avg peakandmin peakare the average and minimum of each interval’s peaks. They read higher than typical use, on purpose.lastis the last interval’s peak.
Kobi sees the same peak you do
Kobi had the same problem, and in its case it was worse. Its metrics tool, get_workload_metrics, returns twelve points per range, so the query’s cost doesn’t grow with the window. At 7 days, each point covers 14 hours.
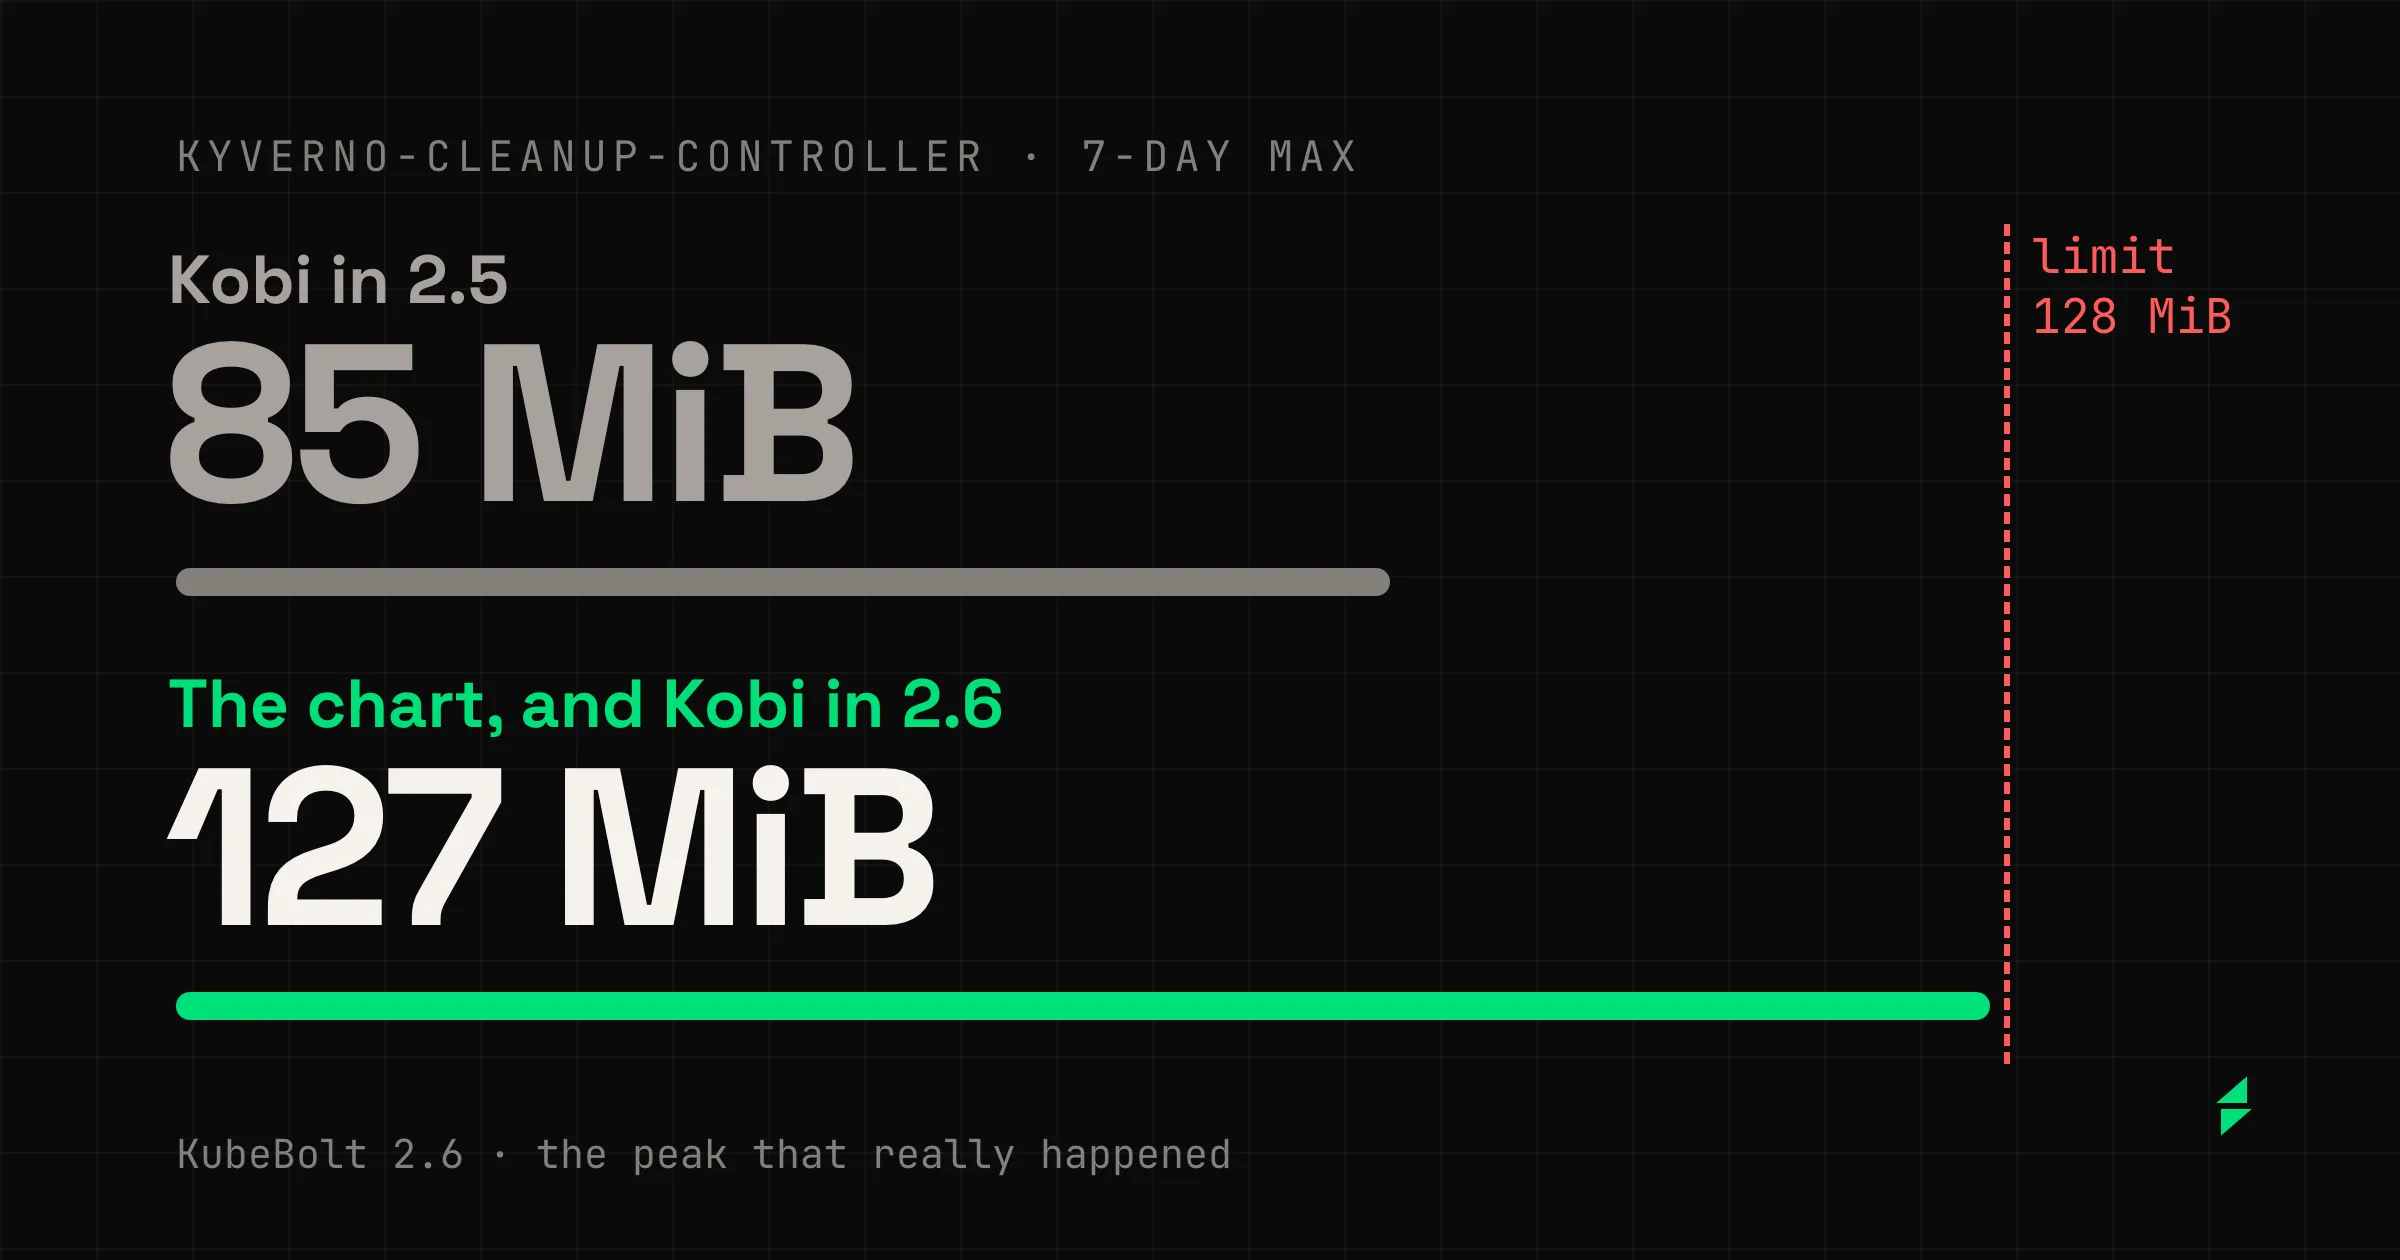
On November 9, in our lab, we asked it for the 7-day memory max of kyverno-cleanup-controller. It said 85 MiB. The Monitor chart showed 127, a MiB under its limit.
kyverno-cleanup-controller · 7-day max
Kobi in 2.5
The Monitor chart
Kobi in 2.6
And Kobi now says when it happened: maxAt
- Kobi’s query looked for the max, but took a single sample from each 14-hour interval.
- It now searches for the peak minute by minute, like the chart, and both give the same number.
- The answer also carries
maxAt, the time of the max. With it, Kobi tells you when it happened, and you can match it against a deploy or a scheduled job.
When you open Kobi from a chart with the Ask Kobi button, it’s told which series are peaks, along with an instruction: “Do not size requests from them; use max for headroom and query the raw series for typical use.”
The request comes from typical use, and the limit’s headroom comes from the peak.
That’s the rule the rest of this post follows.
Two days before the first recommendation
While testing another fix, we connected a new kind cluster and opened Capacity a few minutes later. Right-sizing flagged every workload as over-provisioned. It proposed taking demo-api, a Deployment with 1 core and 1 GiB, down to 10m and 10 Mi, and the card promised 990m and 1014 Mi of reclaimable capacity that didn’t exist. Kobi, through get_right_sizing, said the same.
A workload with no samples at all read as a workload measured at zero, and a workload at zero with a request meets the over-provisioned rule. The existing “preliminary” warning didn’t fire either, because it only checked whether the history was short when there was some.
Since 2.6, right-sizing says nothing until it has two days of history. The reason is written in the code itself: below two days, the P95 hasn’t seen two daily peaks, and a quiet stretch reads as the steady state.
The right-sizing card, by how much history the cluster has
-
Before 48 hours
—
collecting samples — needs ~2 days
14h of ~48h collected
-
At 48 hours
The first recommendations arrive
P95 over 2d
-
From 7 days
The P95 covers the whole week
P95 over 7d
- Until 48 hours, Capacity shows a dash and the hours it has, and Cost explains it’s collecting samples.
- At 48 hours the first recommendations arrive, with the P95 of those two days.
- From 7 days on, the P95 covers the whole week, which is its longest window.
Three more cases worth knowing:
- A workload that has never had a sample gets no recommendation, even once the rest of the cluster has history. A cluster connected without a metrics agent never gets any, because there’s nothing to compute them from.
- A workload that really does nothing still shows as over-provisioned. Measuring zero is data too.
- “well sized” only appears once the evaluation has finished. If the metrics store doesn’t answer, the card says
couldn't read usage history — tries again in 5 min.
The right-sizing rules
Right-sizing doesn’t use a model. It’s three fixed rules, the same on the screens and in Kobi’s answers, so the answer doesn’t change from one time to the next. They apply to CPU and memory separately, over the 7-day P95 of each Deployment, StatefulSet or DaemonSet, with one sample every 5 minutes.
| State | When it fires | What it proposes |
|---|---|---|
| Near limit | The P95 reaches 80% of the limit and sits within 50m of CPU or 100 Mi of memory of it | Limit = P95 × 1.5 |
| Over-provisioned | The P95 is under half the request, and the gap is over 50m of CPU or 100 Mi of memory | Request = P95 × 1.2 |
| No specs | No request or limit, and the P95 is above those minimums | That you set them |
The minimums keep it quiet about near-idle controllers, where a percentage means nothing. Suggestions are rounded to 10m and 10 Mi.
What the table can’t give you is the peak. The P95 leaves out the top 5% of the week, which is 8 hours and 24 minutes, and a six-minute spike doesn’t move it. That’s why a memory limit isn’t decided from the P95 alone.
How I size a container with KubeBolt
- Wait for history. If Capacity says
collecting samples, there’s nothing to decide yet. - Take the request from right-sizing. In Cost or Capacity, the suggestion is the week’s P95 with 20% headroom.
- Take the memory limit from the peak. Open the workload’s Monitor tab on 7 or 30 days and look at
max. If the limit you have in mind sits close to it, don’t lower it. - Ask Kobi when it happened. For example: “What was checkout’s memory peak this week, and when?” With the time, you match it against a deploy, a cron job or a traffic spike, and you know whether it will happen again.
- Watch for OOMs after the change. In Insights, a recurring OOM stays open until the container outlasts its restart interval. You won’t see it close and reopen between one kill and the next anymore.
The rest of 2.6
Every pod’s network came out doubled. The agent sent it along two paths and both copies were stored separately, so summed by pod or by namespace the traffic came out doubled, in the charts and in Kobi’s answers. On Cloud each interface is already counted once. To stop the agent sending the copy, upgrade it to 1.4.8. Your active series will drop, and you’ll see it in Administration › Agents & Ingest › Activity. A pod with hostNetwork shares its node’s network, so it no longer sends network of its own, and its Monitor tab shows the node’s.
The Pods tab pages. A Deployment’s, StatefulSet’s, DaemonSet’s or Job’s shows its pods 50 at a time, by name, and a workload with hundreds of pods opens right away.
Bursts shows the cluster you have open. A toggle shows the ones from all your clusters. “See the N episodes” opens exactly that burst’s episodes, and the count adds up.
Metrics-only clusters work again. They open their dashboards, renaming them works and deleting them removes them from the list.
Autopilot checks the “1/1”. Before calling a pod ready it checks the ready-container count, so a pod that’s Running but not yet Ready no longer passes verification.
Images in Kobi’s chat show as text. A model answer could carry an image, and the browser fetched it on render. Now you see the text, and the page carries an image security policy.
If you install KubeBolt yourself
- Upgrading: 2.6.0 with agent 1.4.8, no migration. 2.6.0 also runs with agent 1.4.7, but network will keep arriving twice.
- VictoriaMetrics, in view: Administration › System › Health has a new section showing what the metrics store receives, its active series, what it accepts and what it drops.
- If you run your own VictoriaMetrics: add
-maxLabelsPerTimeseries=60to its flags. With the default it drops the agent’s series that carry more labels, and only the new section shows you. - When changing chart versions: don’t use
--reuse-values. Pass your values file with-for use--reset-then-reuse-values.
What changes when you size
None of these fixes adds a screen. They change what you were already looking at: the chart you open before touching a limit and the recommendation you read before lowering a request. If you ever lowered a limit looking at a 7-day chart, open it again on 2.6.