AWS has its own agent for investigating incidents, DevOps Agent. I wanted to see how it works next to Kobi with the same incident, the same question and the same read-only permissions. So I set it up in my AWS lab: I removed a network rule from the database and asked both what was going on.
Both found the cause and who caused it. The difference is where each one starts. Kobi starts inside the cluster, where the symptom is, and goes out to AWS when it needs to. DevOps Agent starts in the account and goes through it in parallel. That starting point explains almost everything else: the time, the cost and what each one delivers.
What’s underneath, in five lines:
- A rule removed from the database’s security group takes the shop down. Both agents find the cause, who and when, with read-only permissions.
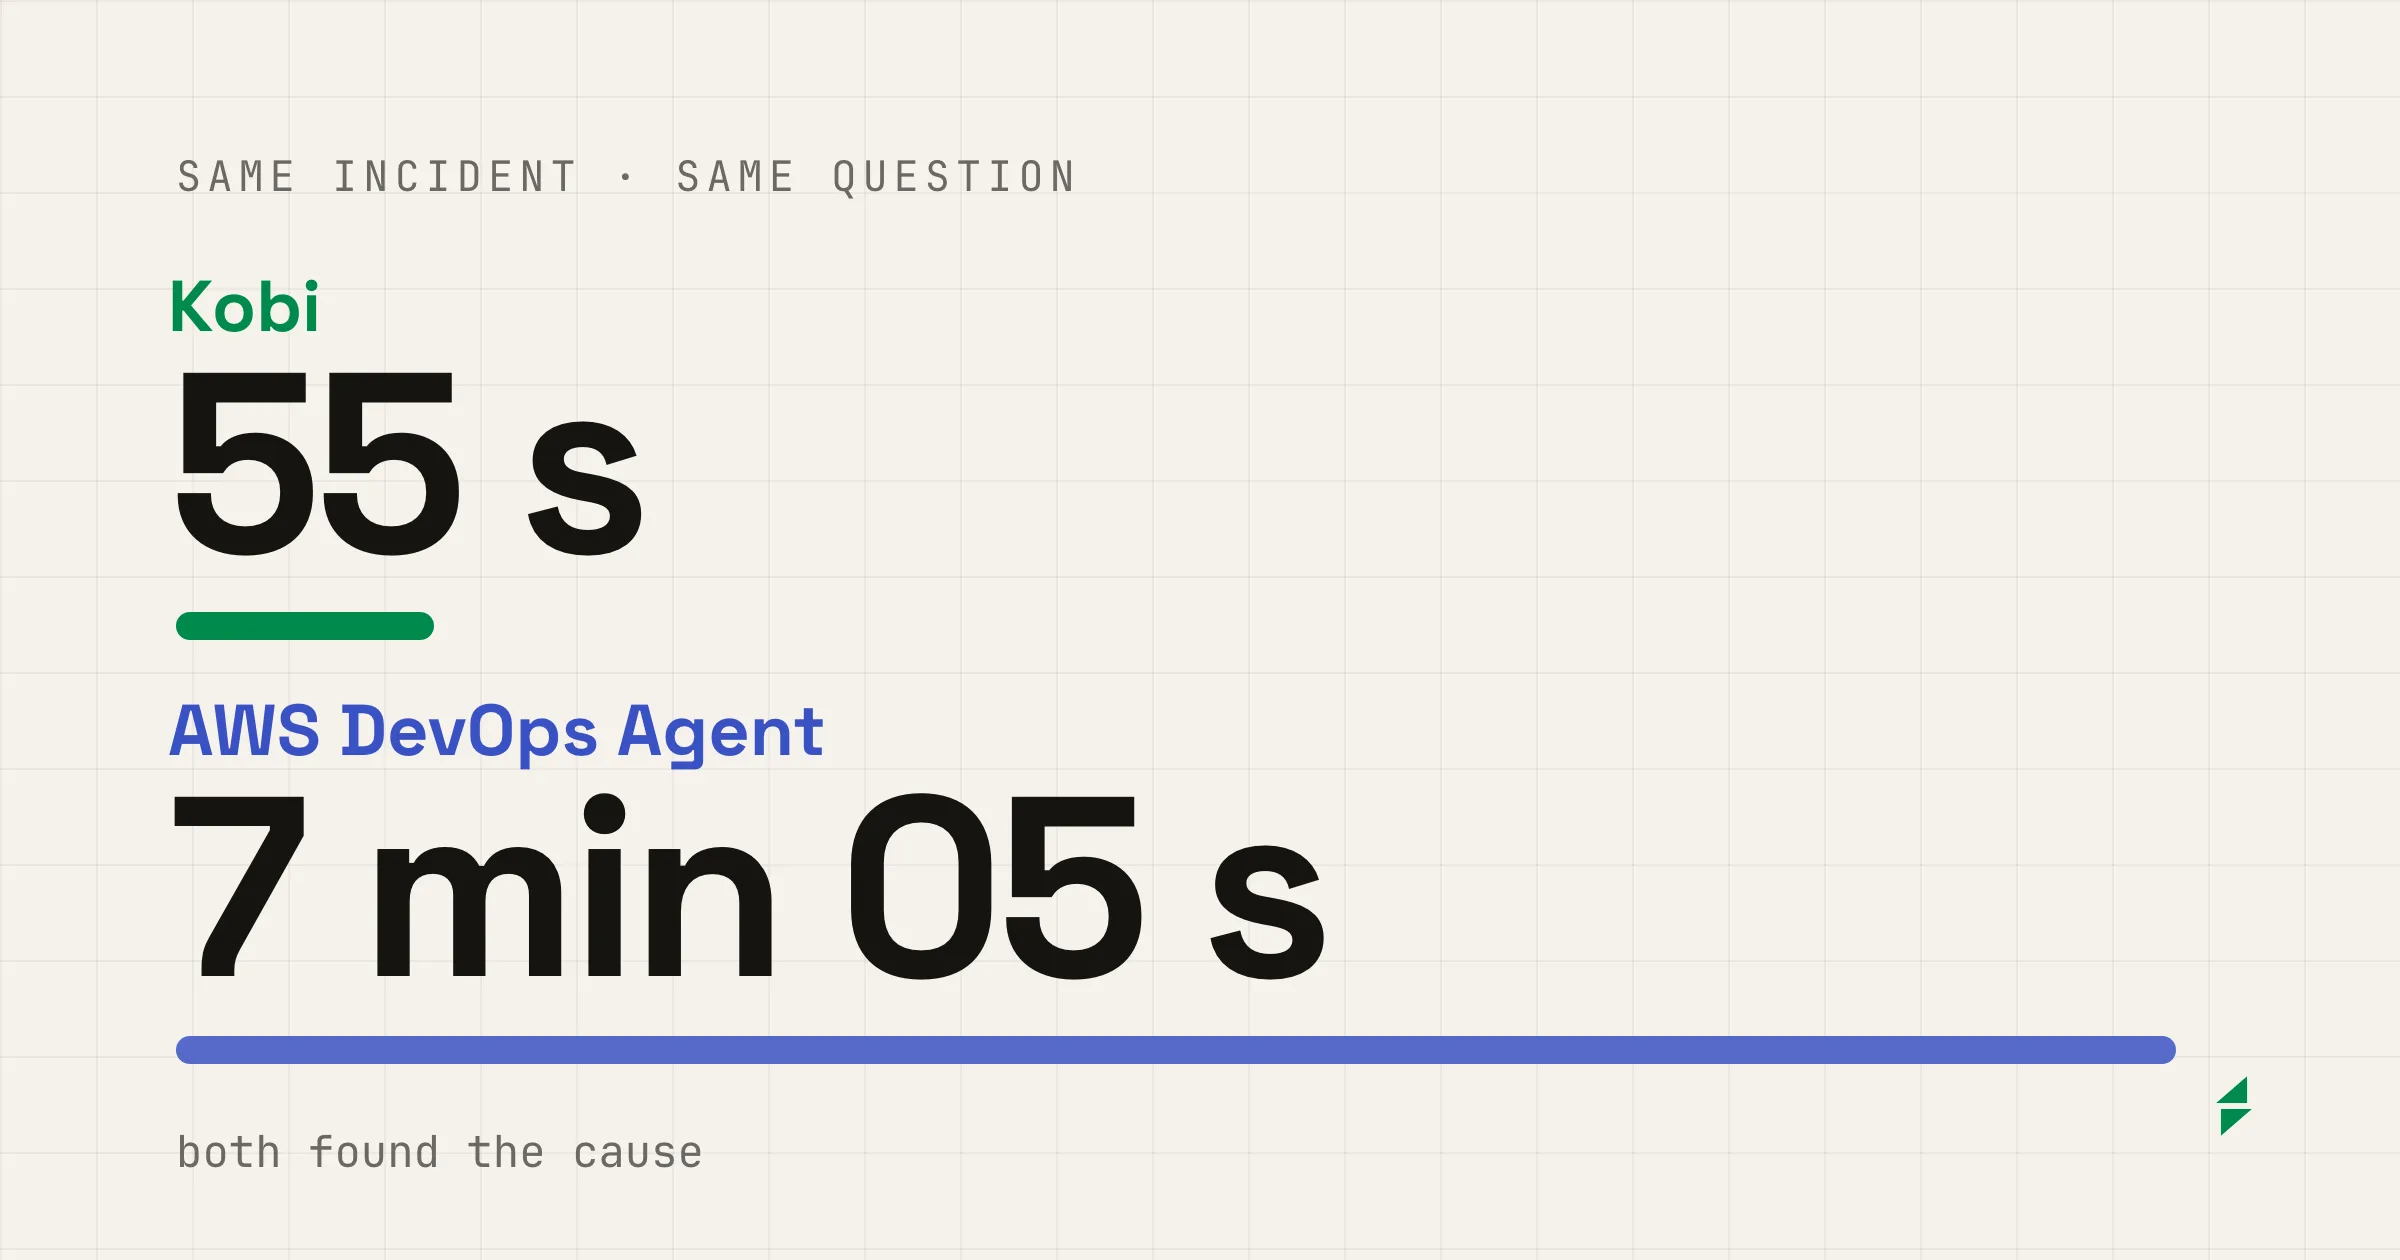
- Kobi answered in 55 seconds. DevOps Agent published the root cause at 7 min 05 s, though it had the proof at 2 min 15 s.
- Kobi cost under $0.50 and DevOps Agent about $3.50, estimated.
- DevOps Agent delivered the more complete report, and also made the most serious mistake of the test.
- It’s a single run on the lab’s simplest incident, and at the end I explain how to read it.
The incident
The lab is a shop on EKS, in us-east-2: the web front end, catalog-api and orders-api, with a PostgreSQL on RDS outside the cluster. Someone removes the rule on the database’s security group that let the pods in. The database stays available, but connections time out, both backends’ readiness fails and their pods drop out of rotation.
- Change
RevokeSecurityGroupIngresson the security group of thekubeshop-lab-pgRDS instance- Rule removed
- TCP 5432 from
10.42.64.0/18, "pods and nodes (private subnets)" - Who
user/kubeshop-lab-operator, with aws-cli- When
- 22:16:05 Madrid time (21:16:05 UTC)
- Effect
catalog-apiandorders-apiat 0 of 2 ready replicas from 22:16:10. The shop returns 5xx errors.- Repair
- The rule is back at 22:38:21 and all four pods are Ready by 22:38:26.
- Question
- "The shop has been returning errors for a few minutes, what's going on?"
What each one answered
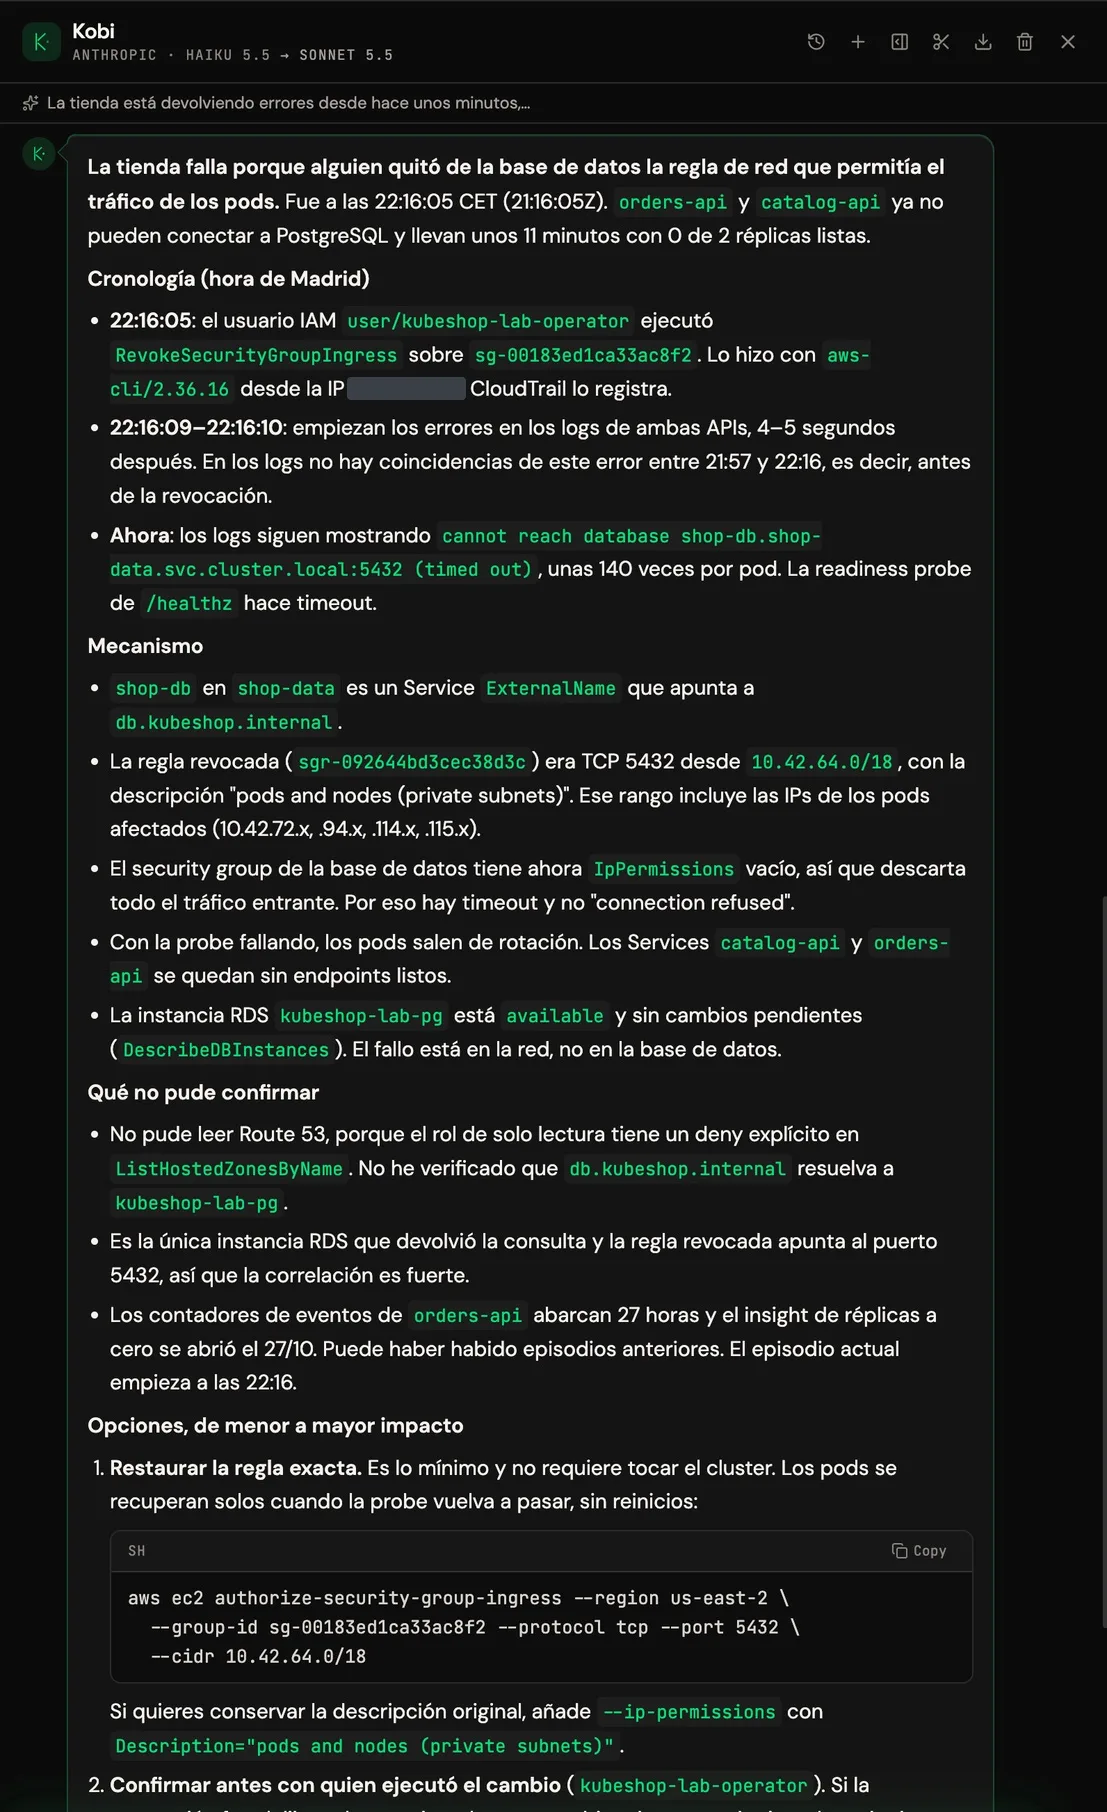
Kobi
KubeBolt · Haiku 5.5, moving to Sonnet 5.5
- Asked
- 22:27:11, 11 min 06 s after the cut
- Reads
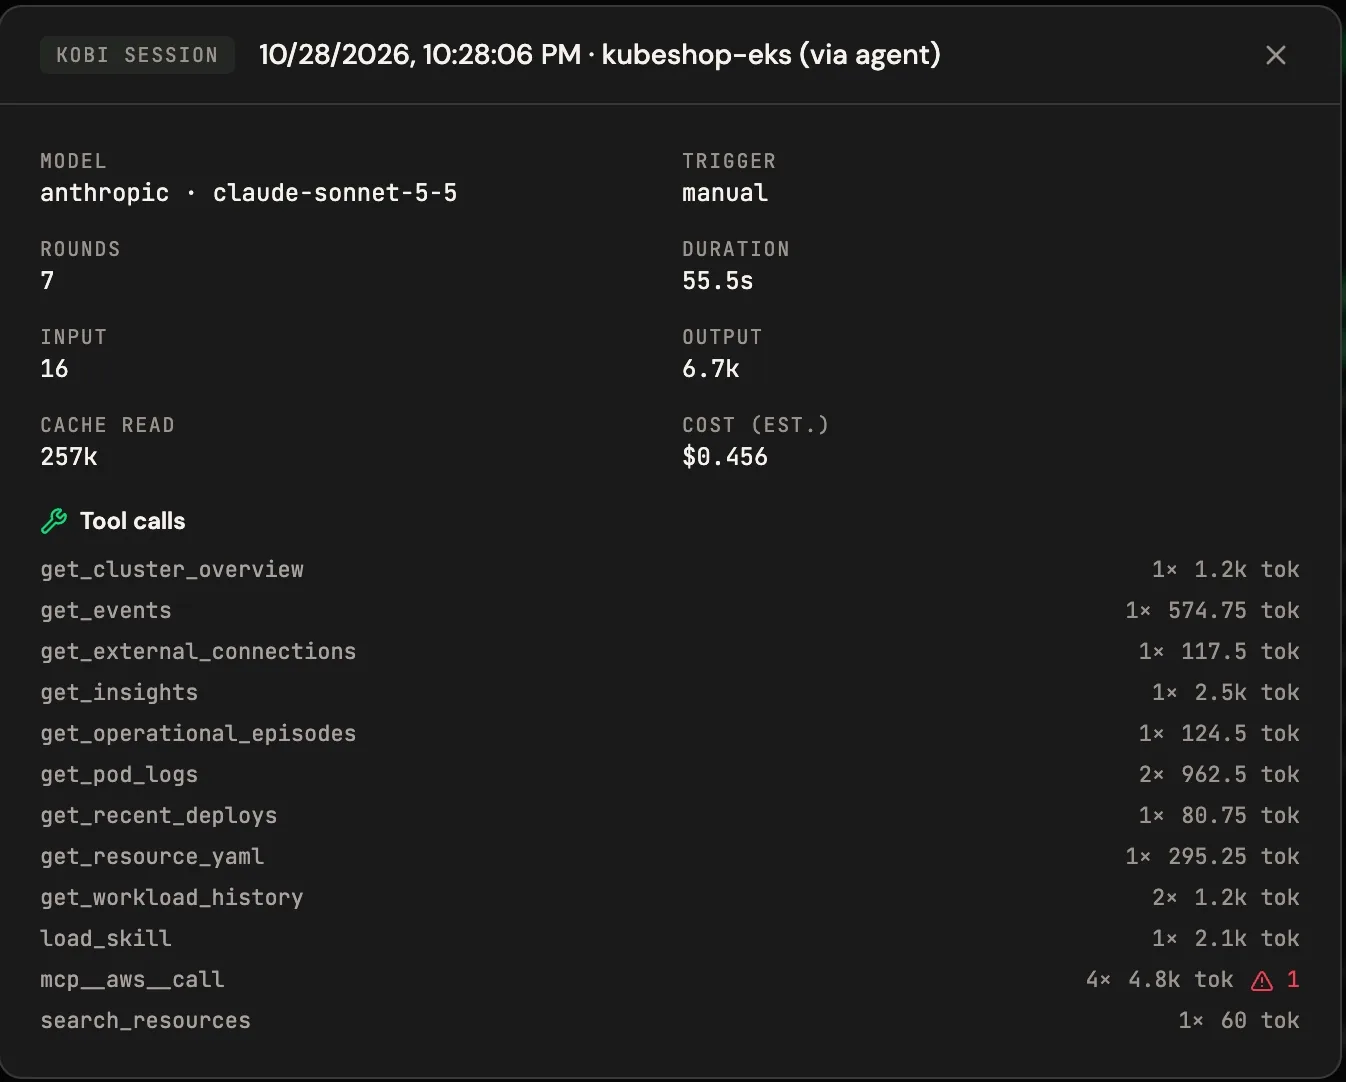
- 12 in the cluster and 4 in AWS (one denied, Route 53)
- Your messages
- 1
- Cost
- $0.456 per the dashboard · ~$0.20 by model
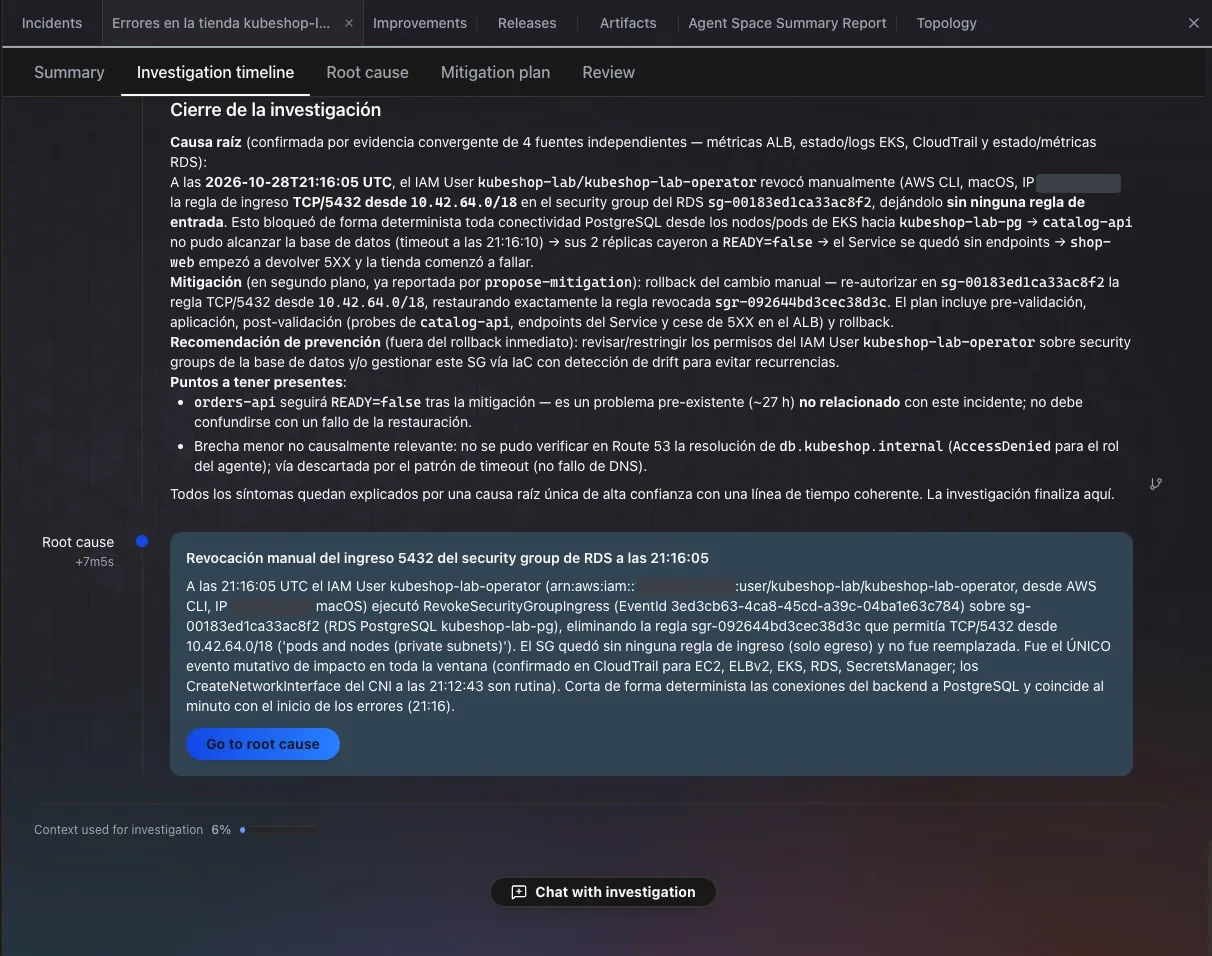
AWS DevOps Agent
Agent Space in us-east-1, its role fenced to us-east-2
- Asked
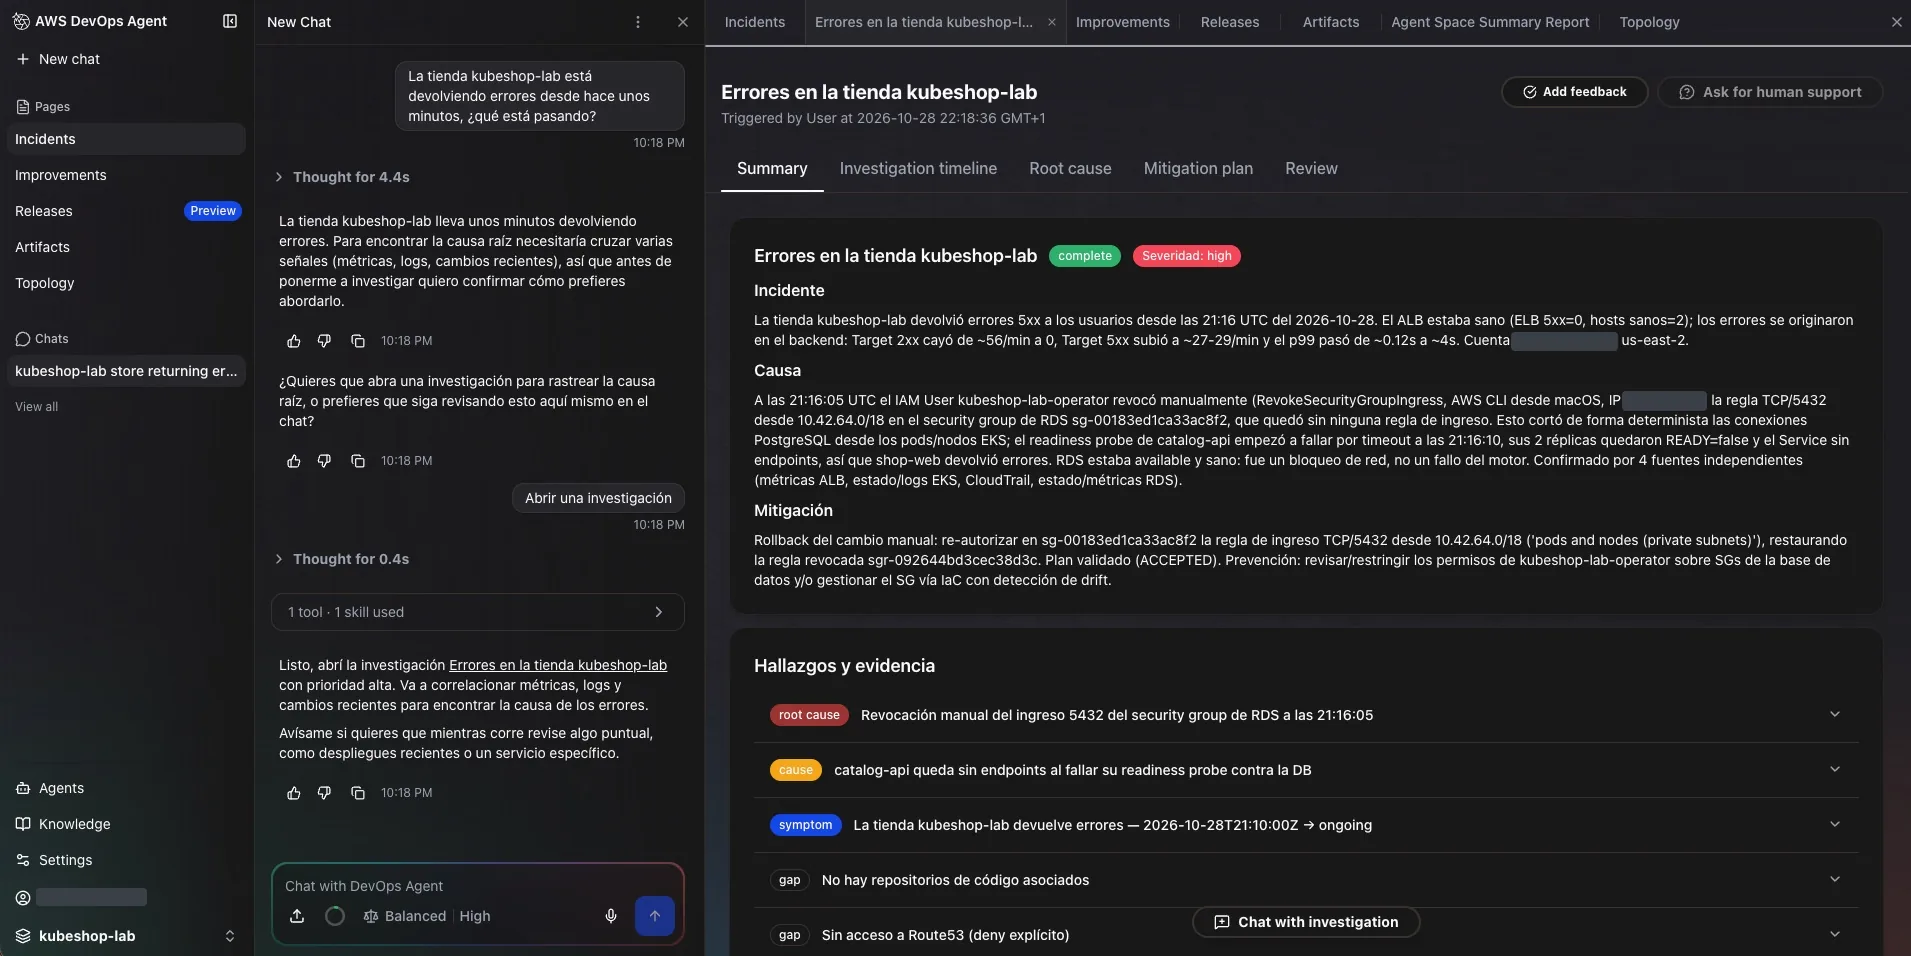
- 22:18:36, 2 min 31 s after the cut
- Reads
- About 20 AWS calls, Route 53 denied and 12 Kubernetes reads
- Your messages
- 2: the question and "Open an investigation"
- Cost
- ~$3.53 estimated
Kobi answered almost eight times faster and for a fraction of the cost, because it started inside the cluster, where the problem was. DevOps Agent took longer, but its incident record is more complete: impact measured with the load balancer’s metrics, four sources cross-checked, and a mitigation plan with the exact command, which it validates itself.
Minute by minute
- 1 You open the investigation from the chat, after the agent asked whether to open one or stay in the chat.
- 2 It has the proof: the
RevokeSecurityGroupIngressin CloudTrail and the security group's rules. 2 min 15 s have passed. - 3 Last AWS call, after checking the security group, the RDS instance and its events.
- 4 It publishes the root cause, at 7 min 05 s.
- 5 You ask Kobi the same question.
- 6 Kobi answers with the cause, who, when and the fix.
At scale
Time
DevOps Agent had the proof at 2 min 15 s. It spent the rest confirming it with other sources and writing the report.
Cost
The dashboard prices all 7 rounds at Sonnet 5.5 rates, but 5 ran on Haiku 5.5, which is much cheaper. DevOps Agent bills the agent's active time: the figure is an estimate, and its free trial or support credits may cover it.
Where each one starts
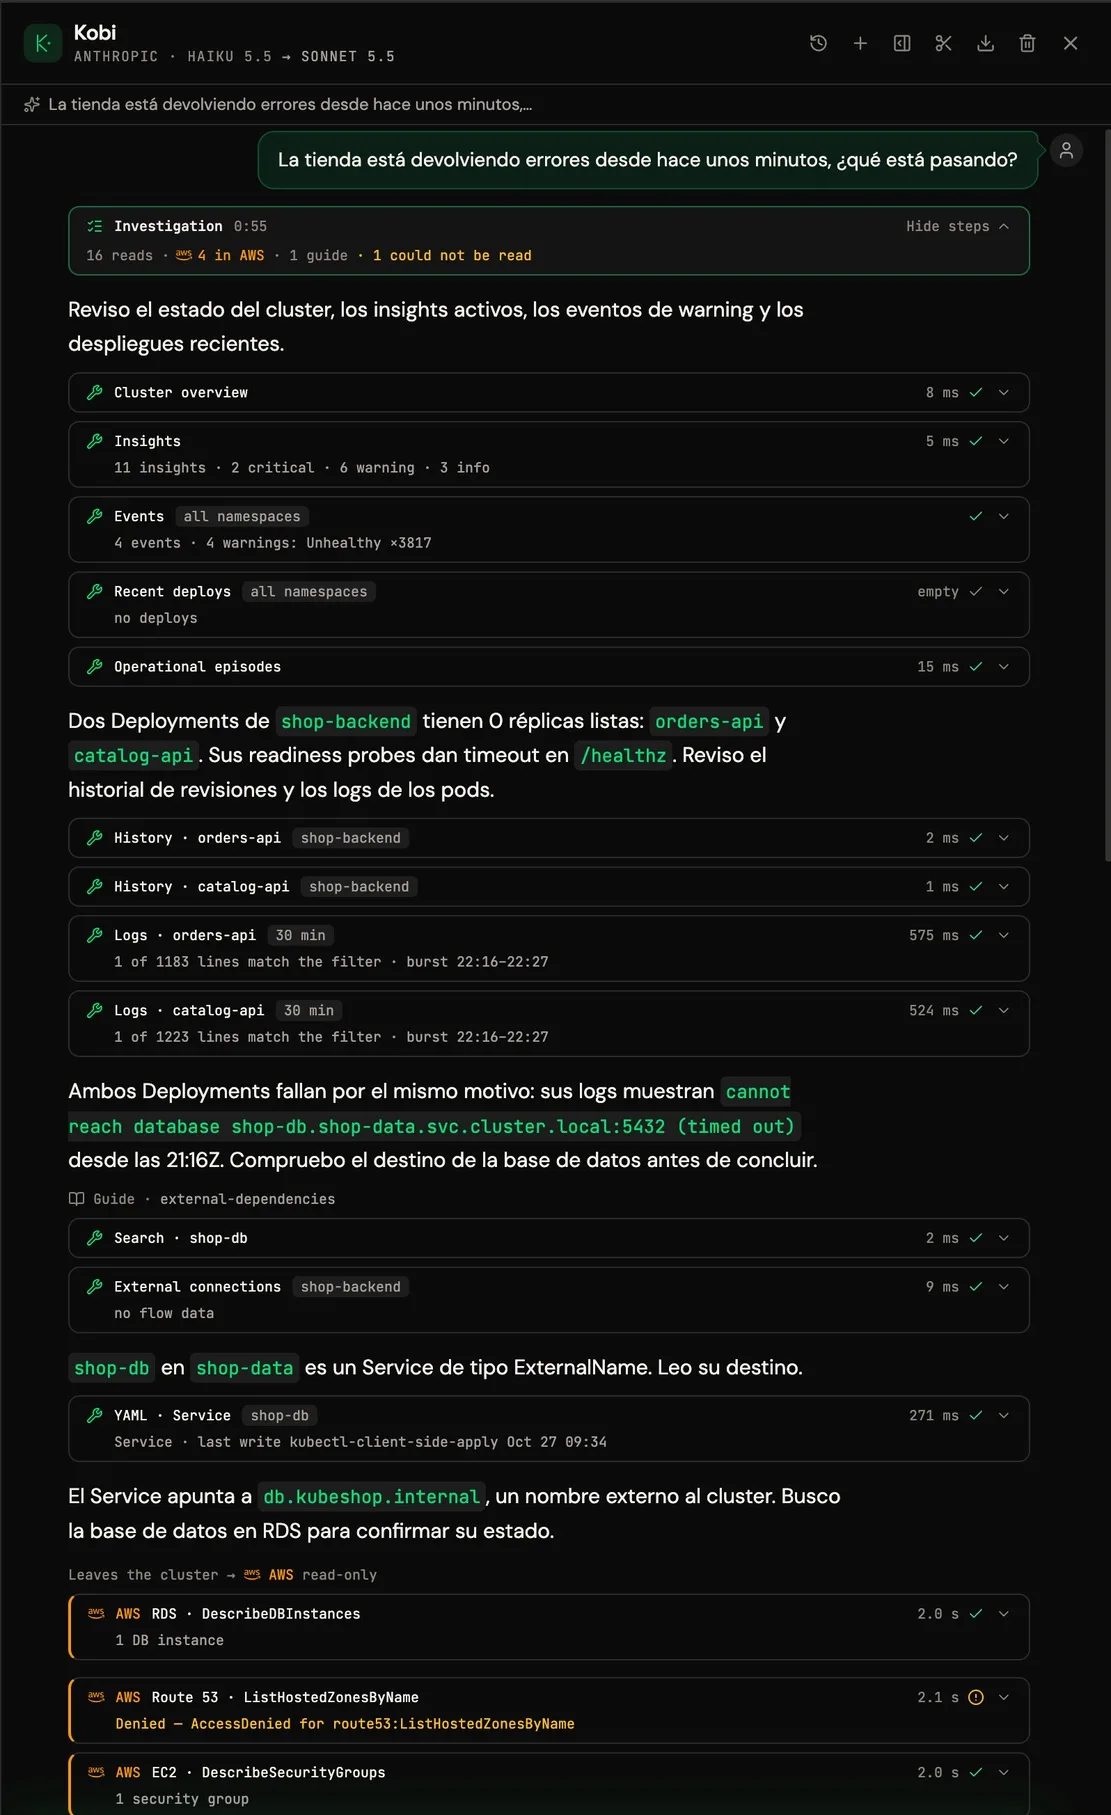
Kobi followed the symptom: the pods with no ready replicas, their logs saying cannot reach database, the Service pointing out of the cluster and, from there, the database in AWS. Four reads in AWS were enough, because by the time it left the cluster it knew what to look for. DevOps Agent went the other way: it queried CloudTrail in parallel across every service, found the change, and then went down into the cluster to confirm it.
Kobi: from the cluster out to AWS
- Cluster state, insights, events (
Unhealthy×3817), deploys and episodes. - History and logs of
orders-apiandcatalog-api:cannot reach database … (timed out)since 22:16. shop-dbis an ExternalName Service pointing atdb.kubeshop.internal.- In AWS: the RDS instance, Route 53 (denied by the fence), the security group and CloudTrail.
- Sonnet 5.5 writes the answer, with timeline, mechanism and options.
7 rounds5 on Haiku and 2 on Sonnet16 reads4 in AWS
AWS DevOps Agent: from the account in to the cluster
- In the chat it reasons for 4.4 s and asks whether to open an investigation.
- Between 22:20:30 and 22:21:30 it runs 12 CloudTrail queries in parallel: EC2, ELB, EKS, RDS, Secrets Manager and every change.
- It goes into Kubernetes through EKS and reads the pods' state.
- Between 22:23:06 and 22:23:52 it checks the security group, the RDS instance, its events and the nodes' security group.
- It closes with root cause, findings, gaps and a mitigation plan it validates itself.
4 sources: ALB, EKS, CloudTrail and RDS6% of its context
Criterion by criterion
The same criteria for both. There’s no final score: each row says what each one did and why it counts as good, partial or wrong.
| Criterion | Kobi | DevOps Agent |
|---|---|---|
| Root cause | Kobi Good Exact rule, port, CIDR and description. | DevOps Agent Good The same, with the CloudTrail EventId. |
| Who, when and from where | Kobi Good kubeshop-lab-operator, 22:16:05, the IP and the aws-cli version. | DevOps Agent Good The same, with the user's full ARN. |
| Services affected | Kobi Good catalog-api and orders-api, with the pods' IPs inside the removed range. | DevOps Agent Wrong Only catalog-api. It says orders-api is an older problem the mitigation won't fix. |
| Start time | Kobi Good 22:16:05, in Madrid time and in UTC. | DevOps Agent Partial The cause at 21:16:05 UTC, but the symptom starting at "21:10". UTC only. |
| Negative proof | Kobi Good No database errors in the logs between 21:57 and 22:16. | DevOps Agent Good The only impactful change across EC2, ELB, EKS, RDS and Secrets Manager. Rules out the CNI noise. |
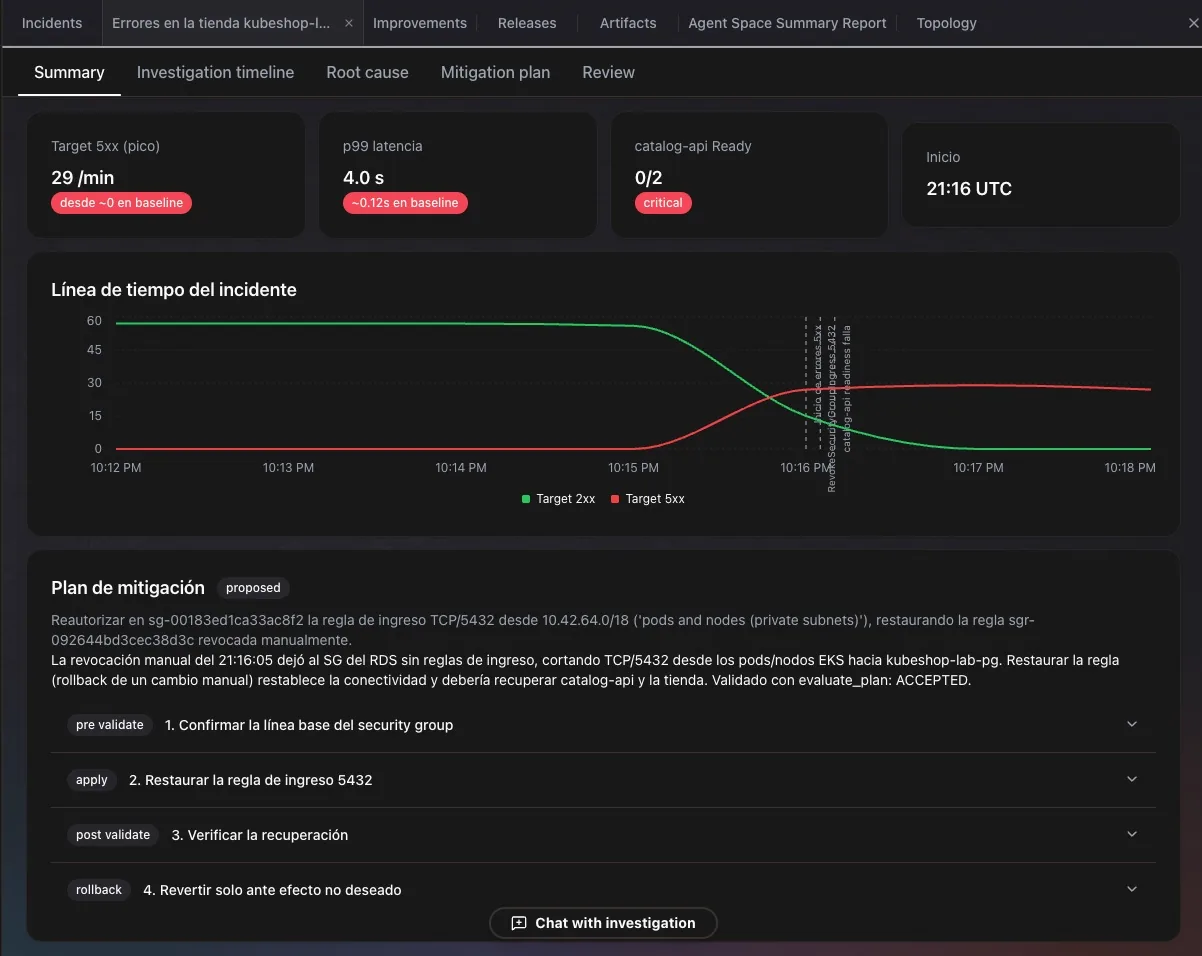
| Measured impact | Kobi Partial Ready replicas and about 140 errors per pod in the logs. | DevOps Agent Good ALB metrics: 2xx from 56/min to 0, 5xx up to 29/min, p99 from 0.12 s to 4 s. |
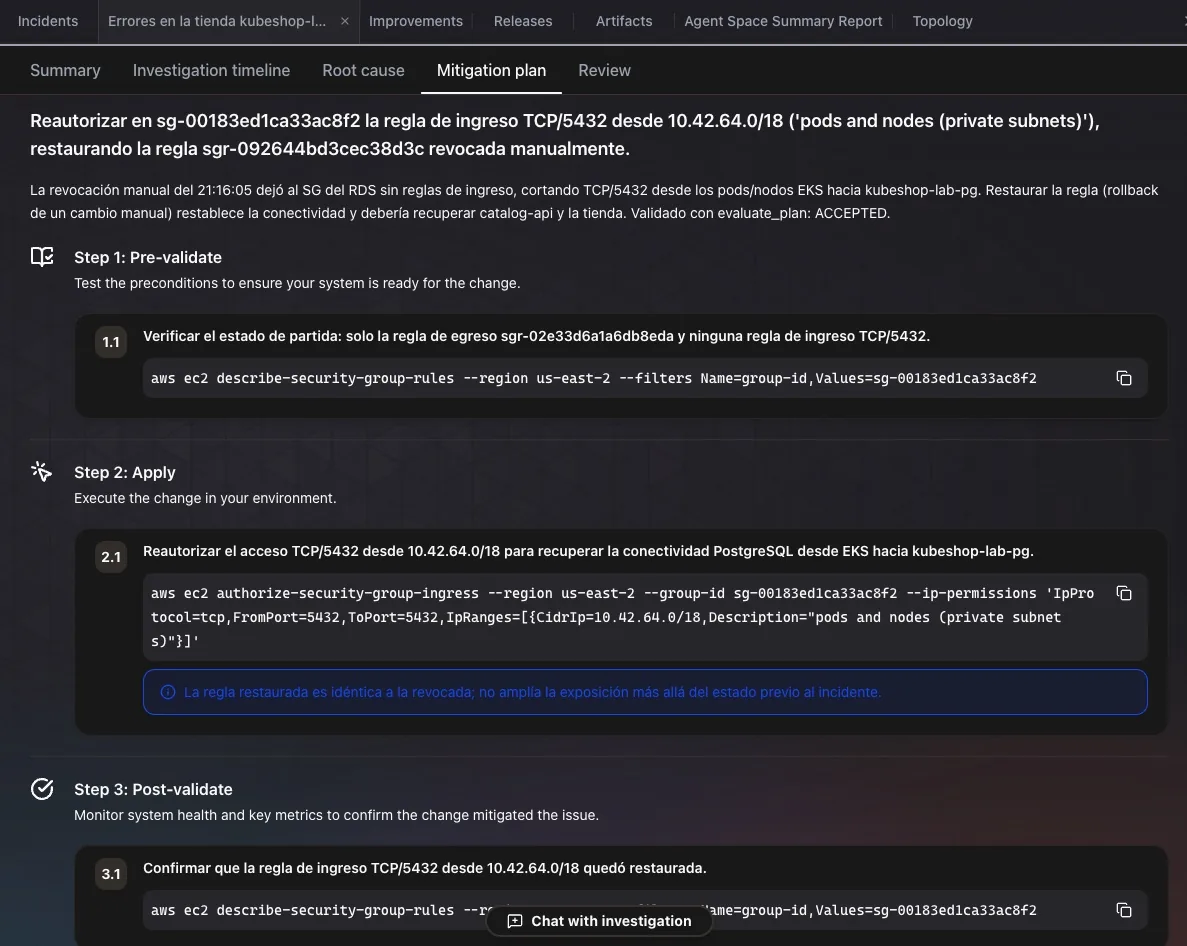
| Fix | Kobi Partial A command with --cidr, without the rule's description, which it mentions separately. | DevOps Agent Good The exact command with the description, checks before and after, and a rollback. |
| CloudFormation origin | Kobi Good Stack kubeshop-lab-base, resource DbSecurityGroup, and it flags the drift. | DevOps Agent Partial Recommends managing the security group with IaC, not seeing that it already is. |
| Prevention | Kobi Partial Confirm the change with whoever made it. | DevOps Agent Good Restrict the operator's permissions on security groups and detect drift. |
| Stated limits | Kobi Good Route 53 denied, and event counters that span 27 h. | DevOps Agent Good Route 53 denied and no code repositories connected. |
The orders-api mistake
It’s the most serious slip in the test, and it’s worth seeing in its own words. Closing the investigation, DevOps Agent wrote (in Spanish, since that’s how it was asked):
“
orders-apiwill stay READY=false after the mitigation — it’s a pre-existing problem (~27 h) unrelated to this incident; it shouldn’t be mistaken for a failed restore.”
It isn’t true. The rule was back at 22:38:21 and both orders-api pods were Ready at 22:38:23 and 22:38:24, just like catalog-api’s. The likely source is Kubernetes events: identical ones get merged, and their counter adds up the lab’s earlier incidents. Kobi saw the same counters and read them carefully: “There may have been earlier episodes. The current one starts at 22:16.”
The risk is practical. Following the report, an operator wouldn’t expect orders-api to recover when the rule was restored, and would go looking for another cause that doesn’t exist. Checking more sources didn’t prevent it, because the mistake didn’t come from a missing source but from a misread piece of cluster data.
What Kobi learns from DevOps Agent
The table has three rows where DevOps Agent did better, and all three are work for Kobi:
- The full command. DevOps Agent restored the rule with its description, and added a check before, another after, and a rollback. Kobi gave the command without the description and mentioned it separately.
- Measured impact. DevOps Agent measured impact with the load balancer’s metrics: 2xx responses fell from 56 a minute to 0 and p99 went from 0.12 s to 4 s. Kobi measured it in replicas and log lines.
- Prevention. DevOps Agent proposed restricting the operator’s permissions on security groups and detecting drift. Kobi stopped at confirming the change with whoever made it.
How to read the comparison
- It’s a single run per agent, on the lab’s simplest incident.
- The questions weren’t simultaneous: DevOps Agent got it 2 min 31 s after the cut and Kobi 11 min 06 s after. The CloudTrail event was available to both.
- Both had the same read-only fence: us-east-2 only, with IAM and Route 53 limited to the lab. That’s why neither could read Route 53.
- DevOps Agent had no repositories or other integrations connected. Kobi reaches the cluster through the KubeBolt agent.
- The costs are estimates: DevOps Agent’s with its public per-agent-second price; Kobi’s from KubeBolt’s dashboard and recomputed by model.
The AWS connector, available now
The AWS connector Kobi used in this test shipped on October 27 in KubeBolt 2.5, the open-source edition, alongside Azure’s. You set it up in Administration › AI (Kobi) › Connectors, and the drawer prints the IAM role and its trust policy, with the external ID already in it.
The AWS MCP server has no read-only mode: it runs code with the caller’s identity. That’s why the protections live in KubeBolt and in the role, and repeat on purpose:
- The model writes no code. Kobi asks for a service, an operation and parameters, and KubeBolt writes the script that runs.
- One table, three filters. The gateway’s allowlist, the session policy and the role’s policy come from the same table, so they can’t contradict each other.
- No secrets, no data. The role denies Secrets Manager and Parameter Store values, KMS decryption, S3 objects, DynamoDB items and a function’s code.
- An external ID nobody picks. KubeBolt generates one per organization, and the admin only copies it into the role’s trust policy.
What’s left
Both agents reached the same cause by opposite routes. Starting where the symptom is gets an answer in a minute, for cents. Going through the whole account gets a more complete report, at the price of time and cost. Neither route protects you from misreading a piece of cluster data, and that’s what to measure in an incident agent: whether it finds the cause, and whether everything it claims around it is true.