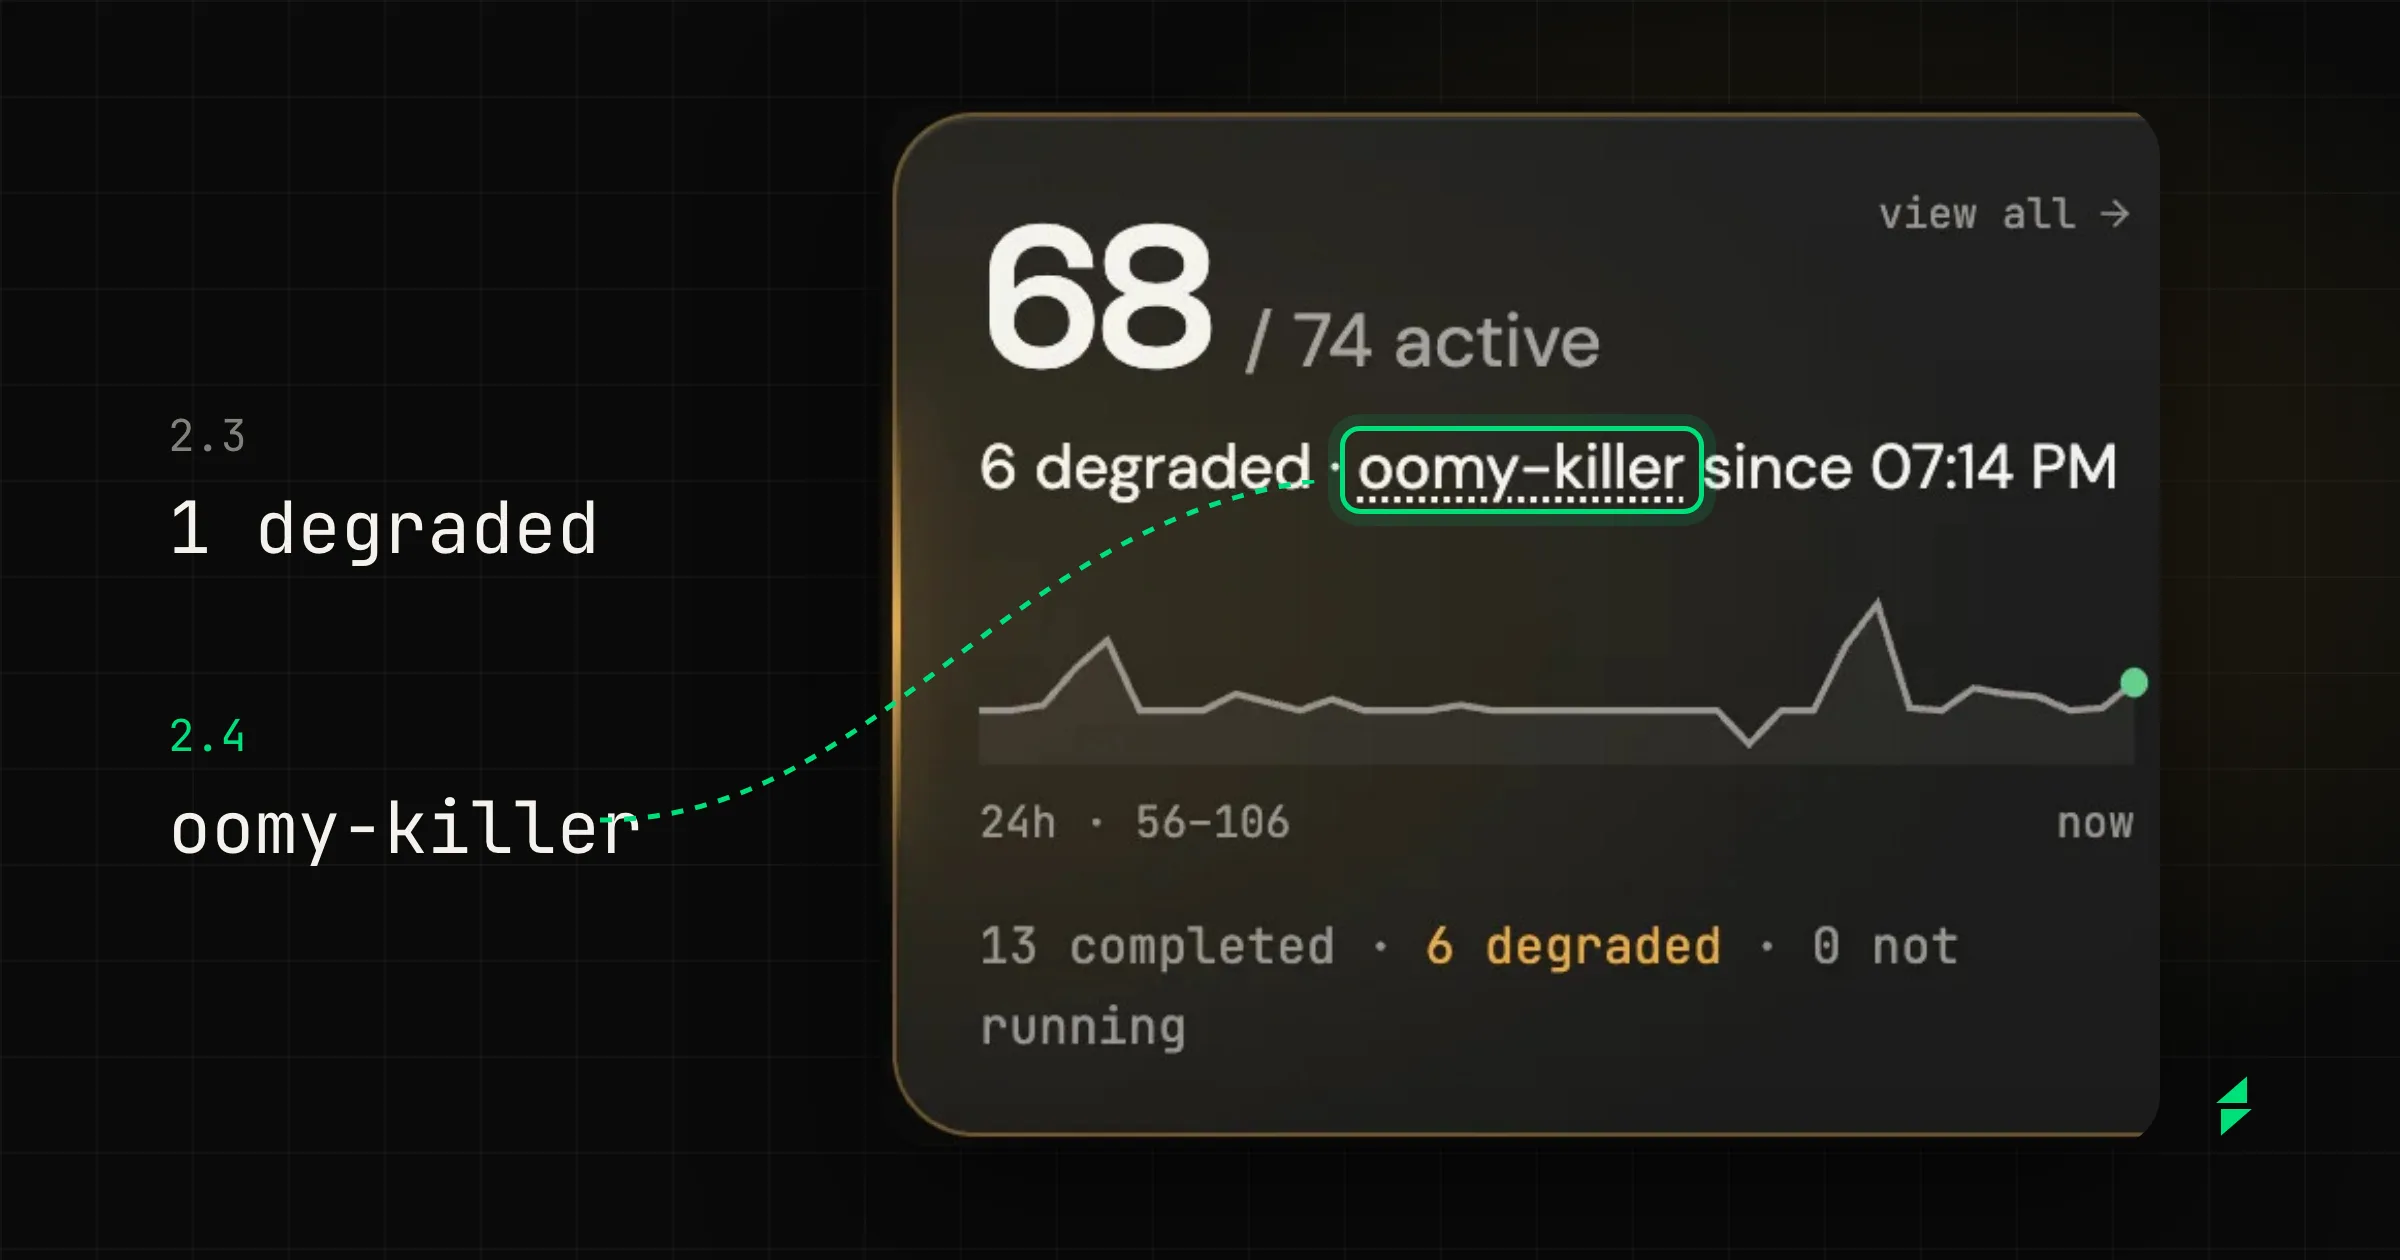
Up to 2.3, when Overview’s Pods card lit up, it said something like “1 degraded”. You knew a pod was in trouble, but not which one. To find out, you opened the pod list and looked for it.
In 2.4 that same card says “6 degraded · oomy-killer since 07:14 PM”, and the name is a link. It’s the change you’ll notice most: a lit card names what’s failing, says since when, and takes you to where the detail is. And it reaches every dashboard.
Here I go through what each card says now and what happens to a cluster when its agent stops connecting, and at the end I sum up the rest. If you only want to know what’s in 2.4:
- Every lit card names the resource, says since when, and links to it.
- A cluster whose agent stops connecting shows as “No contact”, with the time contact was lost.
- Autopilot switches models in two stages after measuring them: Claude Haiku 5.5 for triage and Sonnet 5.5 for the investigator.
- You can rate every Kobi answer with 👍 or 👎, and its errors say who can fix them.
- KubeBolt watches itself: health dashboards for its API and for Kobi, alert rules, and an external watcher for when the API is what goes down.
Overview’s row, before and now
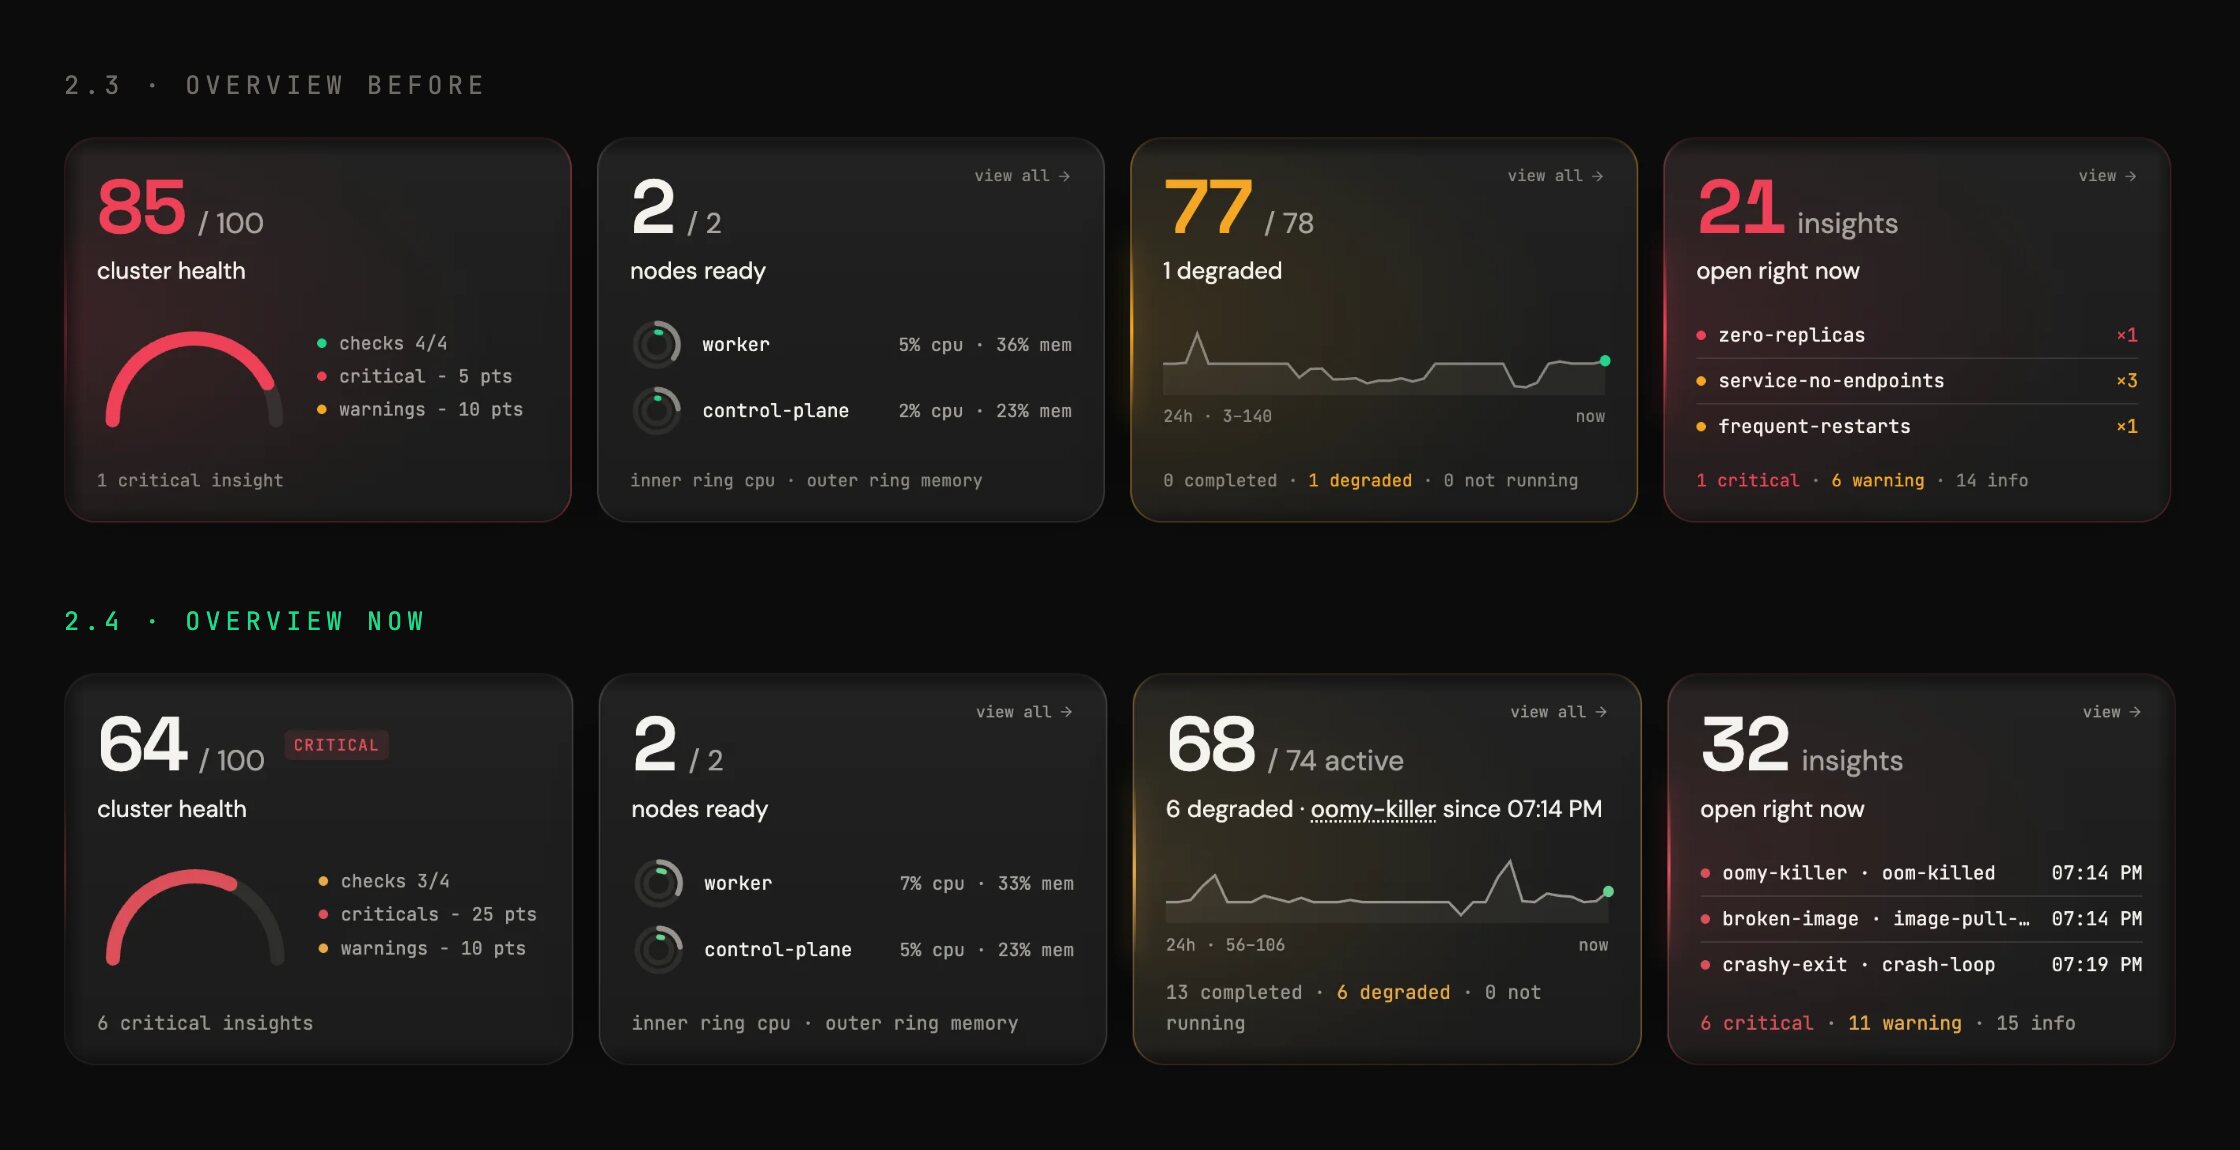
Look at the two cards on the right. In 2.3, Pods said “1 degraded” and Insights listed the rules that fired most, like service-no-endpoints ×3, without saying which resource they hit. In 2.4, Pods names what’s failing and the time it started, and Insights lists each case with its resource, its rule and its time: oomy-killer · oom-killed · 07:14 PM.
When there are more cases than fit, the card shows the first one and the rest appear when you hover over it. The order is always the same: per resource, most severe first and, within the same severity, newest first. If a rule has three or more cases, the link takes you to Insights with the filter already set.
What each lit card names
A card still lights up when its figure needs someone to look at it. What changes is the sentence under it:
| Dashboard and card | What it names when it lights up |
|---|---|
| Overview · Pods | what’s failing and since when, e.g. “3 degraded · oomy-killer since 04:47 PM” |
| Overview · Nodes | the node that isn’t ready and since when (a cordoned node counts too) |
| Overview · Insights | each case with its resource, its rule and its time |
| Overview · Recent Events | events grouped by object, with rollouts recognized as such |
| Reliability | the workload behind each signal (5xx, hot-spots, latency and drops), e.g. “mostly orders-api · 0.2 req/s” |
| Capacity and Nodes | the node behind each card and since when it isn’t ready, the node that peaked, and the workloads that ended up OOMKilled |
| Fleet and Home | the worst cluster, and the agent that went down with its time |
| Security | the rule and workload of each runtime threat |
| Cost | the node where idle spend piles up |
| Autopilot | only “Awaiting approval” lights up; the credits card, when lit, links to Plan & credits |
The name links to the resource or to the panel that holds the detail. What the table can’t tell you is why it’s failing: the card gives you the resource and the time, and the cause is still in its events, its logs, or whatever was deployed right before. That’s what Kobi is for, and it has its own button (the K) on every row. Rows take you to the resource, and Kobi only opens when you ask for it.
If a card has color, the sentence under it already tells you who to look at and since when.
The color rules
While making the cards name things, we also went over when each one lights up, because sometimes two lit up for the same fact and some counts stayed red forever. We ended up with four rules for dark mode:
- One fact lights one card. Cluster health gives the verdict with its score, its chip (Critical, Warning or Healthy) and the color of its bevel, but it no longer glows: the card that lights up is the one that lists the cases (Insights, Nodes or Pods). In the 2.3 post I told you Cluster health lit up with a critical insight. It doesn’t anymore, because it repeated Insights.
- The figure never takes the state color. The glow, the chip, the bar and the caption carry the state, and the figure reads the same in any state.
- Posture isn’t treated as an incident. Open CVEs describe how the cluster is, so they never light their card. Runtime threats do.
- The pill at the top tells the truth. It can read Live, Delayed, Disconnected or Connecting. Up to 2.3 it always said “Live”.
On Reliability the thresholds are now: 5xx from 1%, latency when it rises 25% and at least 20 ms, and one L4 drop a minute.
Every dashboard also uses the same range control, and on a resource’s Monitor tab a single range applies to all its charts. On Cloud, a period longer than your plan keeps stays in the list with a lock and the note “Your plan keeps N days of history”.
A cluster without its agent
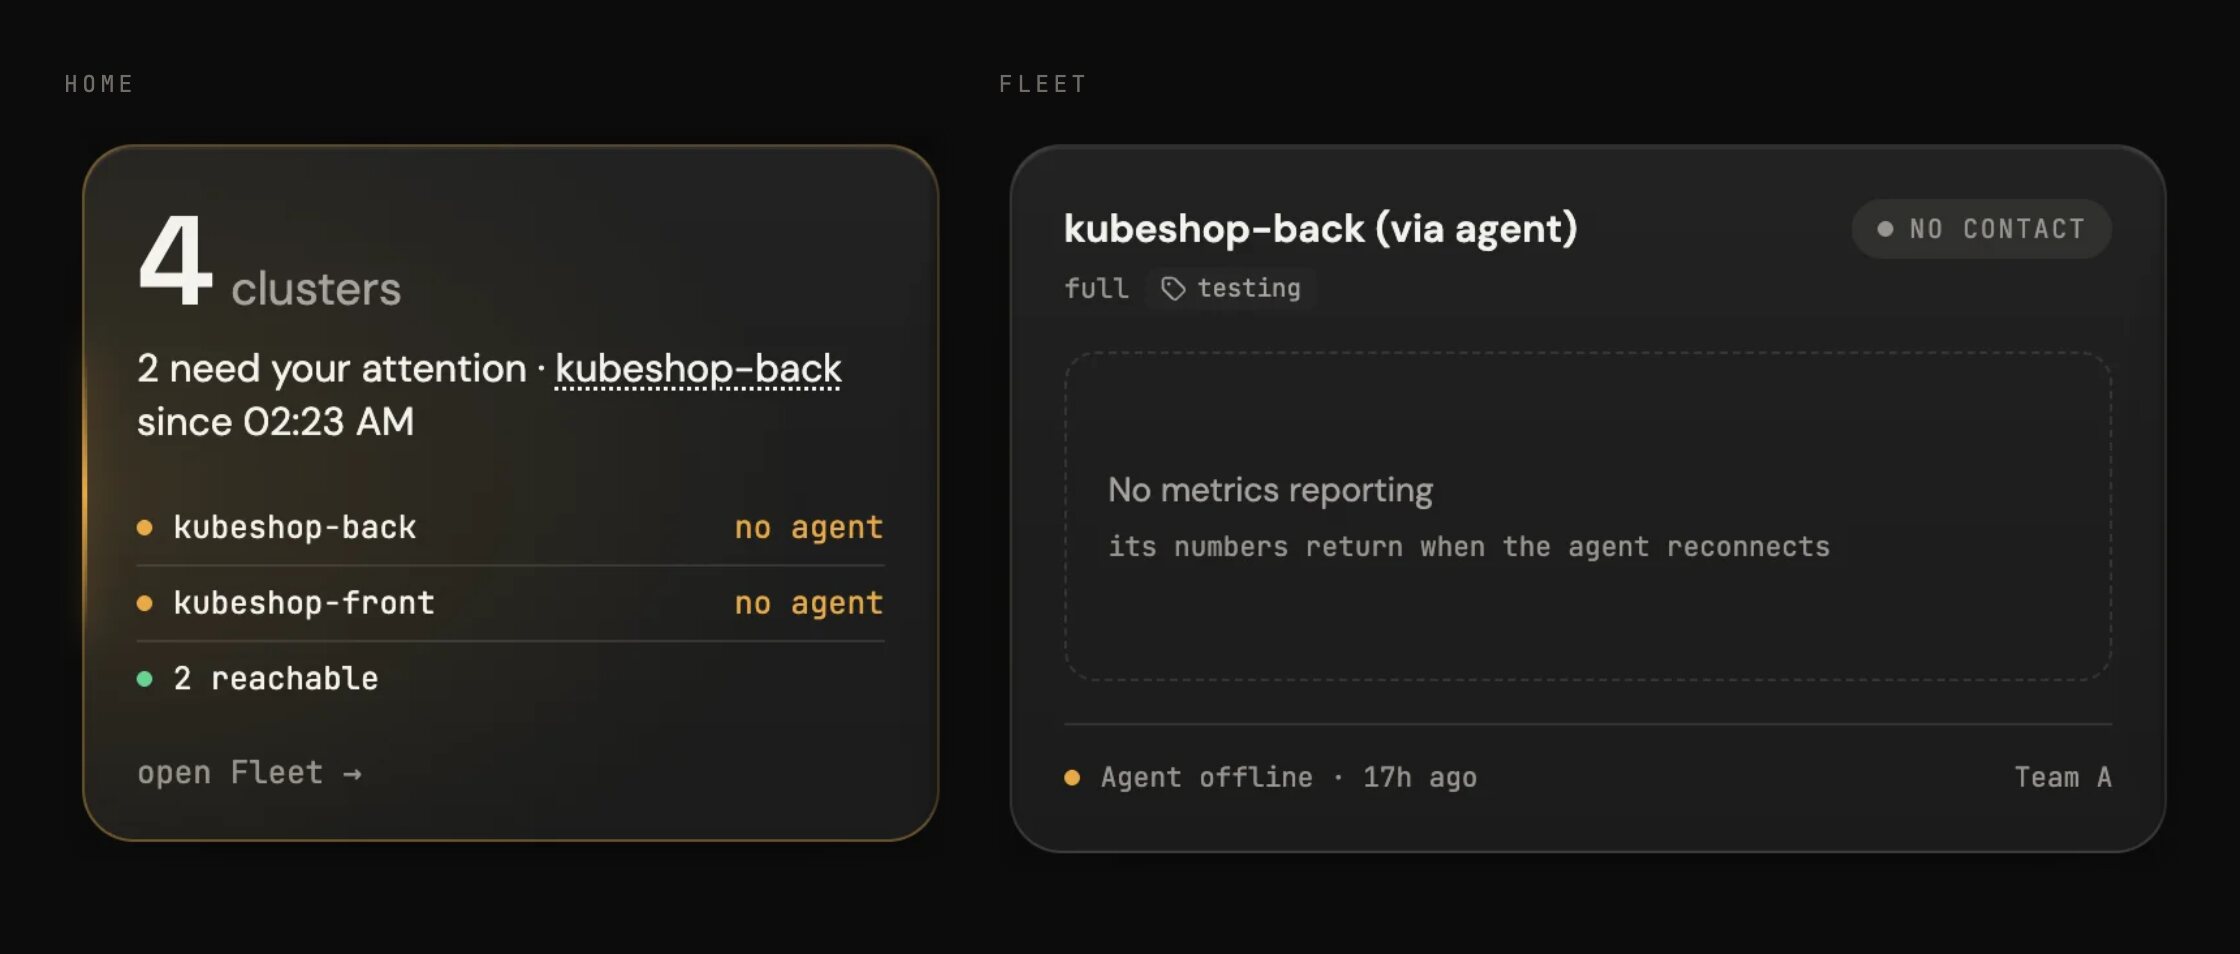
Up to 2.3, when a cluster’s agent stopped connecting, KubeBolt kept showing the last thing it had received as if it were current: the node “1/1 ready”, the pods Running, zero events, the “Live” label and health at 100. Kobi read that same data and answered with it. It was the data from the moment the agent left, and nothing on screen said so.
In 2.4, while no agent from your organization is connected to that cluster:
- The cluster’s pages show a “No contact with this cluster since” notice with the time and how long ago it was.
- The pill at the top reads “Disconnected”, and the health card drops its score and shows a grey “No contact” chip.
- Fleet and Home give it the
NO CONTACTverdict and count it among the clusters that need attention. - Kobi marks the cluster overview as the last known state. KubeBolt can’t tell whether the agent, its node or the network went down, and it says so.
When the agent comes back, everything recovers on its own. Loss is tracked per organization, so another organization’s agent on the same cluster doesn’t hide that yours is gone.
KubeBolt watches itself too
Until 2.3 we watched your clusters and not our own. A slow API route, a late background job, a VictoriaMetrics refusing writes or a Kobi that kept failing only came to light if someone complained. In 2.4, KubeBolt measures its own API, its ingest and Kobi, and alerts whoever runs it. If you run KubeBolt yourself, that’s you, and this part is for you.
| Where | What it shows |
|---|---|
| Administration › System › Health | API replicas and memory, the 5xx share and HTTP by route group (a 503 from a dead cluster is counted apart from the API failing). Background jobs, late ones first. VictoriaMetrics measuring itself and the API’s calls to it. And the agents: live channels per replica and the Kubernetes requests that crossed the tunnel, by result (ok, timeout, agent_closed…) with their p50 and p95 |
| Administration › AI › Health | Kobi’s turns and how they ended, provider errors and what the fallback model rescued, refusals and cut-short answers, tools that failed or came back empty, latency, cost, tokens and the prompt cache |
Both tabs read series the API pushes to VictoriaMetrics every 30 seconds. Every series carries instance, run_id and job, so a restart never sneaks in as a counter going back to zero. That’s not a small detail: on the ingest activity screen, reading the counters without it hid 10,335 rate-limited requests after a restart.
Looking at a dashboard won’t wake you at 3 a.m., so 2.4 brings two more pieces:
- Alert rules on the API and on Kobi, unit-tested with
promtool. The chart creates them as aPrometheusRulewithmetrics.alertRules.enabled. - An external watcher. No alert running inside the API can tell you the API is down. With
KUBEBOLT_EXTERNAL_METRICS_URL, the API pushes a copy of its health series to an outside Prometheus such as Grafana Cloud, with a dashboard you import as is. Only series with no organization or cluster cross.
On KubeBolt Cloud we use the same thing, extended to every organization: an operations view with five tabs (the API, ingest, VictoriaMetrics and Kobi, plus an overview) and 25 alert rules, 10 on the platform and 15 on Kobi. One thing we care about most is that one problem raises one alert: while the metrics push is failing, the rules that depend on it are held, and a four-minute VictoriaMetrics outage went from 15 alerts to one. That’s how we find out Kobi is failing in your organization, or that its 👎 are growing, without you having to write to us.
Everything else in 2.4
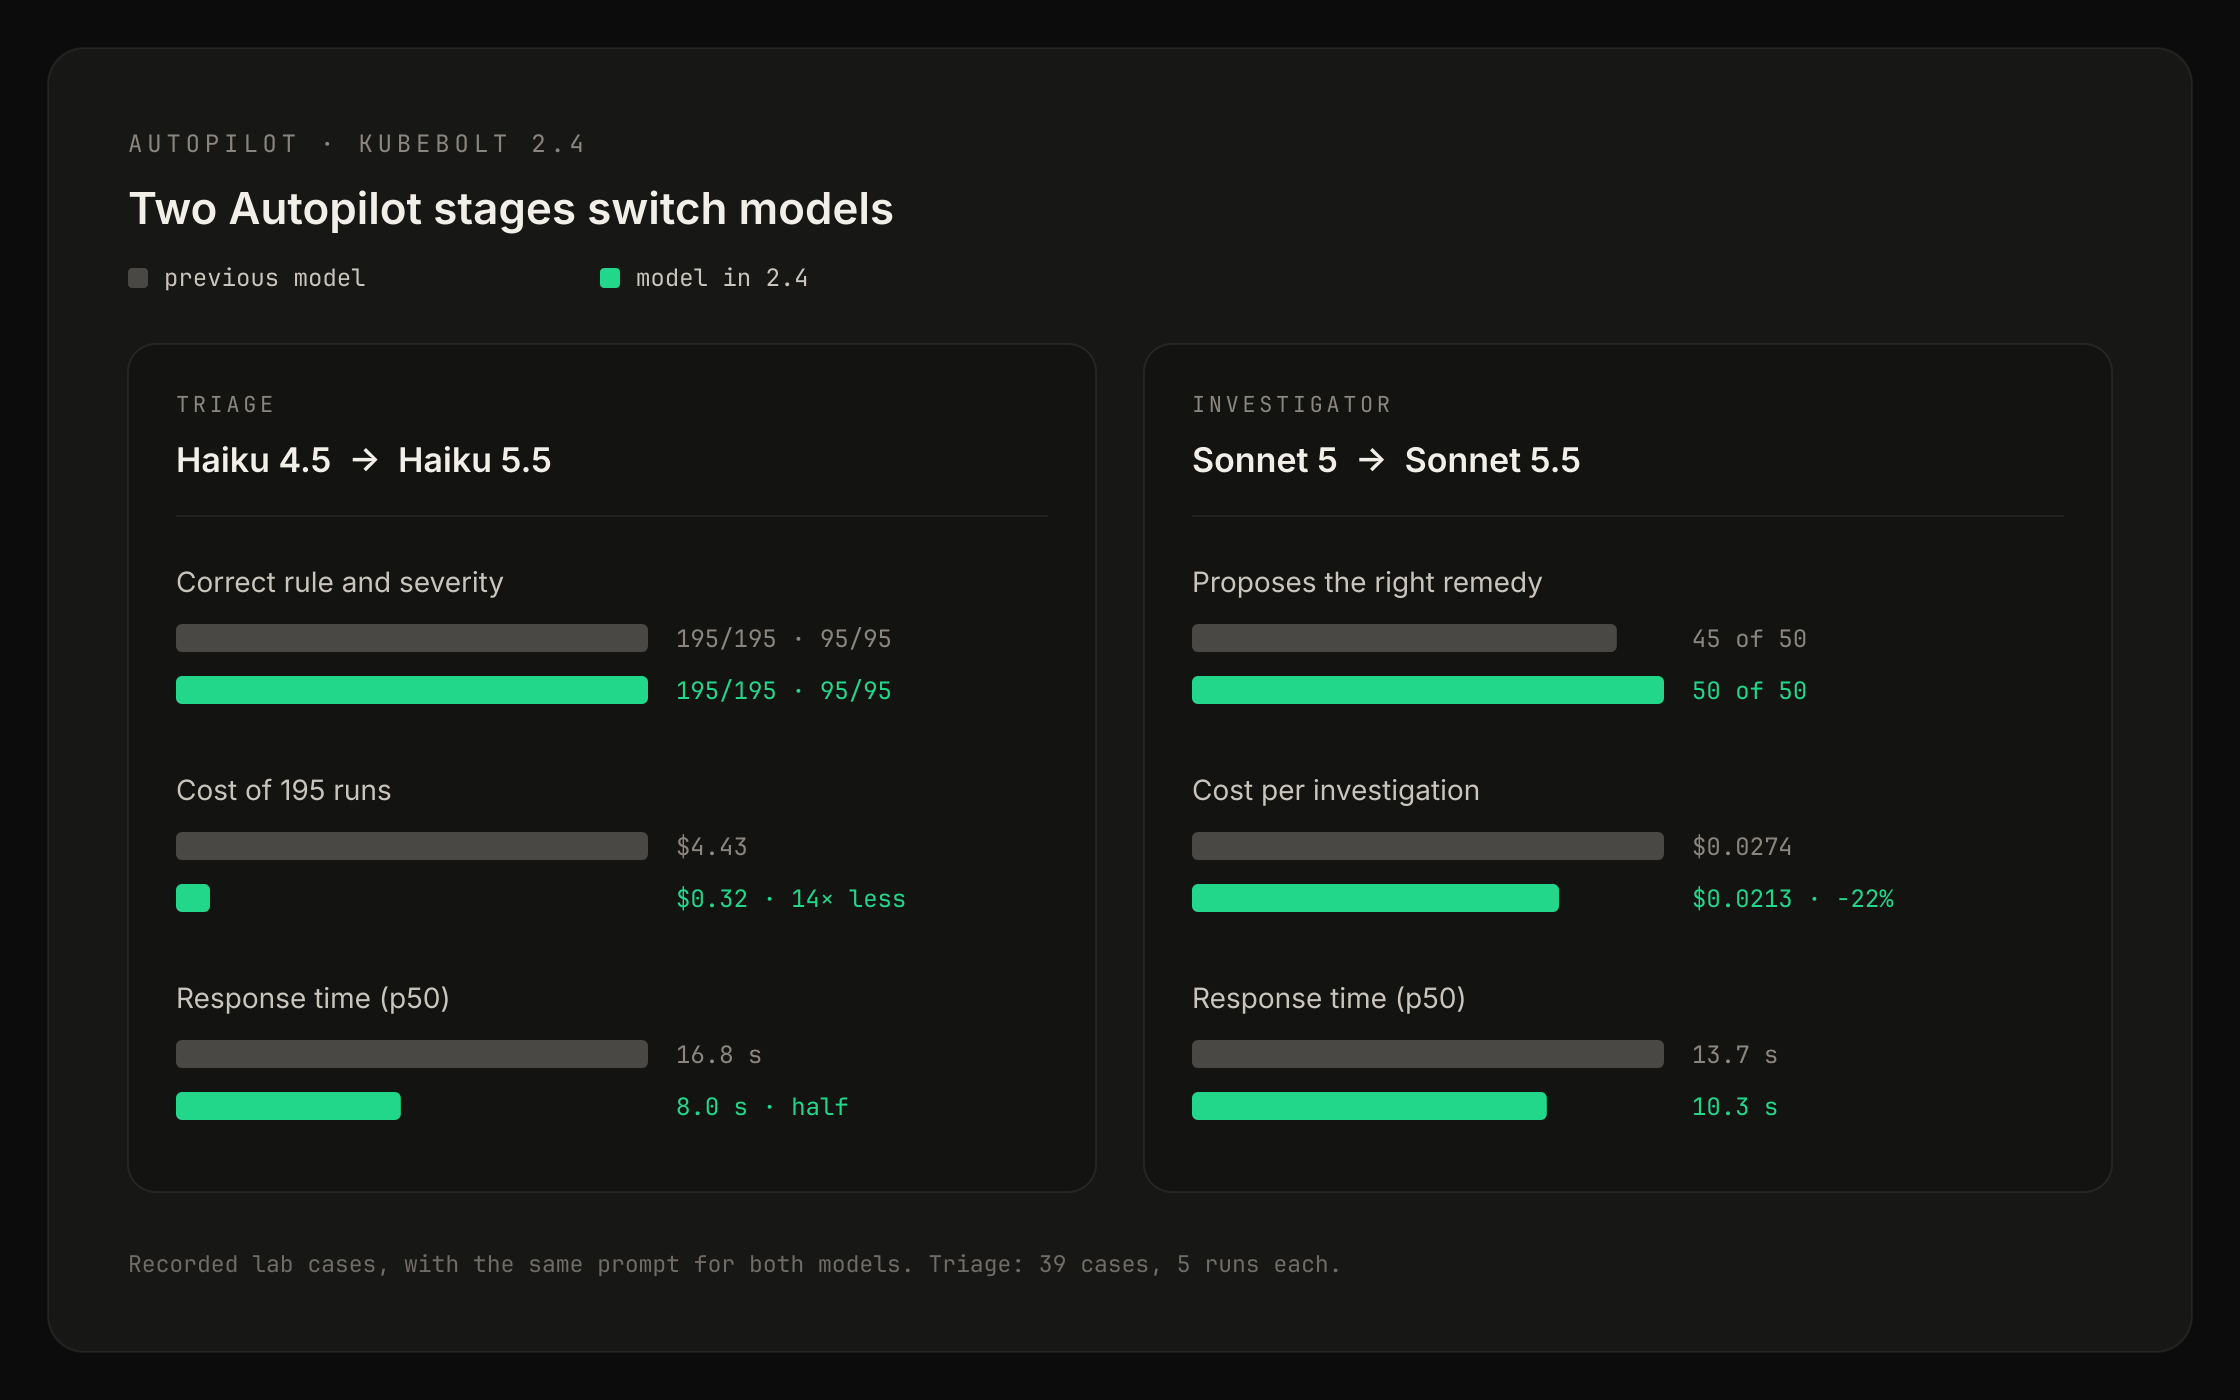
Autopilot switches models in two stages. Before changing a stage’s default model, we compare it with the one it already used, on the same cases recorded in our lab and with the same prompt. Triage, which classifies the incident, moves to Claude Haiku 5.5 with reasoning off: on 39 cases, run five times each, it got the rule and severity right as often as Haiku 4.5, at about a fourteenth of the cost and half the response time. With high reasoning it did worse: 21 of the 195 runs didn’t finish within their five turns or their 180 seconds. The investigator moves to Sonnet 5.5, which proposed the right remedy in 50 of 50 cases, against 45 with Sonnet 5, and costs 22% less per investigation.
If you already picked a model, yours stays: the new ones apply on install or with “Reset to defaults”.
Kobi. Every answer has a 👍 and a 👎. The last vote counts, and the same icon withdraws it. If you pick 👎 you can give a reason and leave a comment, which is stored with your conversation, never becomes a metric, and is deleted with it. Errors no longer show the AI provider’s raw response: each kind has a fixed sentence that says who can fix it, whether that’s our support, your organization’s admin, or you, by trying again. In Kobi you can also pick Haiku 5.5 and Sonnet 5.5; its default is still Sonnet 5.
remote_write. When Prometheus catches up after an outage and goes over the limit, KubeBolt answers 503 with Retry-After and Prometheus retries it, so the backlog is no longer lost. We recommend adding retry_on_http_429: true to your config.
What survives an API restart, if you run KubeBolt yourself: a deleted cluster no longer comes back, agent records left as “connected” now expire, and the cluster you had selected is remembered.
Start here
What we’re after with this release is that a dashboard’s first row is enough to know where to start: what’s failing, since when, and where to look. That when KubeBolt can’t know how a cluster is doing, it says so. And that if what’s failing is KubeBolt itself, you hear it from an alert, not from a user.
If you’re on Open Source, upgrade to 2.4.0 and the agent to 1.4.4. One note for the upgrade: a cluster no longer disappears when its agent goes; it stays listed as “No contact”. If you relied on it disappearing, delete it in Clusters. On Cloud everything is already updated.
Open Overview on your cluster and look at the first row. If a card has color, click the name on it.
If you don’t use KubeBolt yet, start free: two clusters, no time limit.