When you open a cluster in KubeBolt, the pod list, the map and the insights don’t ask your API server anything. They read from a copy of the cluster that KubeBolt keeps in memory and that keeps itself up to date. That’s why the portal answers instantly, and why spending an hour looking at a cluster adds almost nothing to its load.
That copy has a price: it has to be brought in whole on connect. On a small cluster that takes a few seconds. A few weeks ago, a customer connected a development cluster with 140 namespaces and 5,632 ReplicaSets, and the first connect couldn’t finish. The fixes shipped across four releases, from 2.6.4 to 2.7. Here’s how the load works and what changed. If you only want to know what shipped:
- The initial load arrives in pages of 500 objects, through the agent too.
- KubeBolt no longer downloads whole lists every few minutes: the copy check counts without downloading, and Helm’s history stays in the cluster until a view asks for it.
- While a cluster loads, you see the steps, what has arrived and how much is left.
- Agent 1.4.10 gets more memory by default, and when a response doesn’t fit it answers with an error instead of restarting.
- When a cluster opens dozens of insights at once, you get one summary instead of one alert each.
Why KubeBolt loads the cluster on connect
There are two ways to show a cluster in an interface. One is to ask the API server every time someone opens a view, so that every list, filter and refresh is a request. The other is what Kubernetes’ own controllers do: ask for the full list once, then listen only for changes. KubeBolt does the second, with client-go’s informers.
What travels between your cluster and KubeBolt
From the API server to KubeBolt
From the portal to the in-memory copy
- On connect, KubeBolt checks what its role may read and asks for the full list of every resource type it’s allowed.
- From then on it keeps one watch per type, and the API server sends only what changes: a new pod, a scaled Deployment, an event.
- The lists, the cluster map and the insights, evaluated every 60 seconds, read from that copy. Moving around the lists and the map sends no requests to your cluster.
The full load only happens again in three cases: the first time, when KubeBolt restarts and when the connection was lost. The rest of the time, what travels is the changes.
The expensive part is bringing the copy in once. From then on, what travels is the changes.
What a large cluster’s load weighed
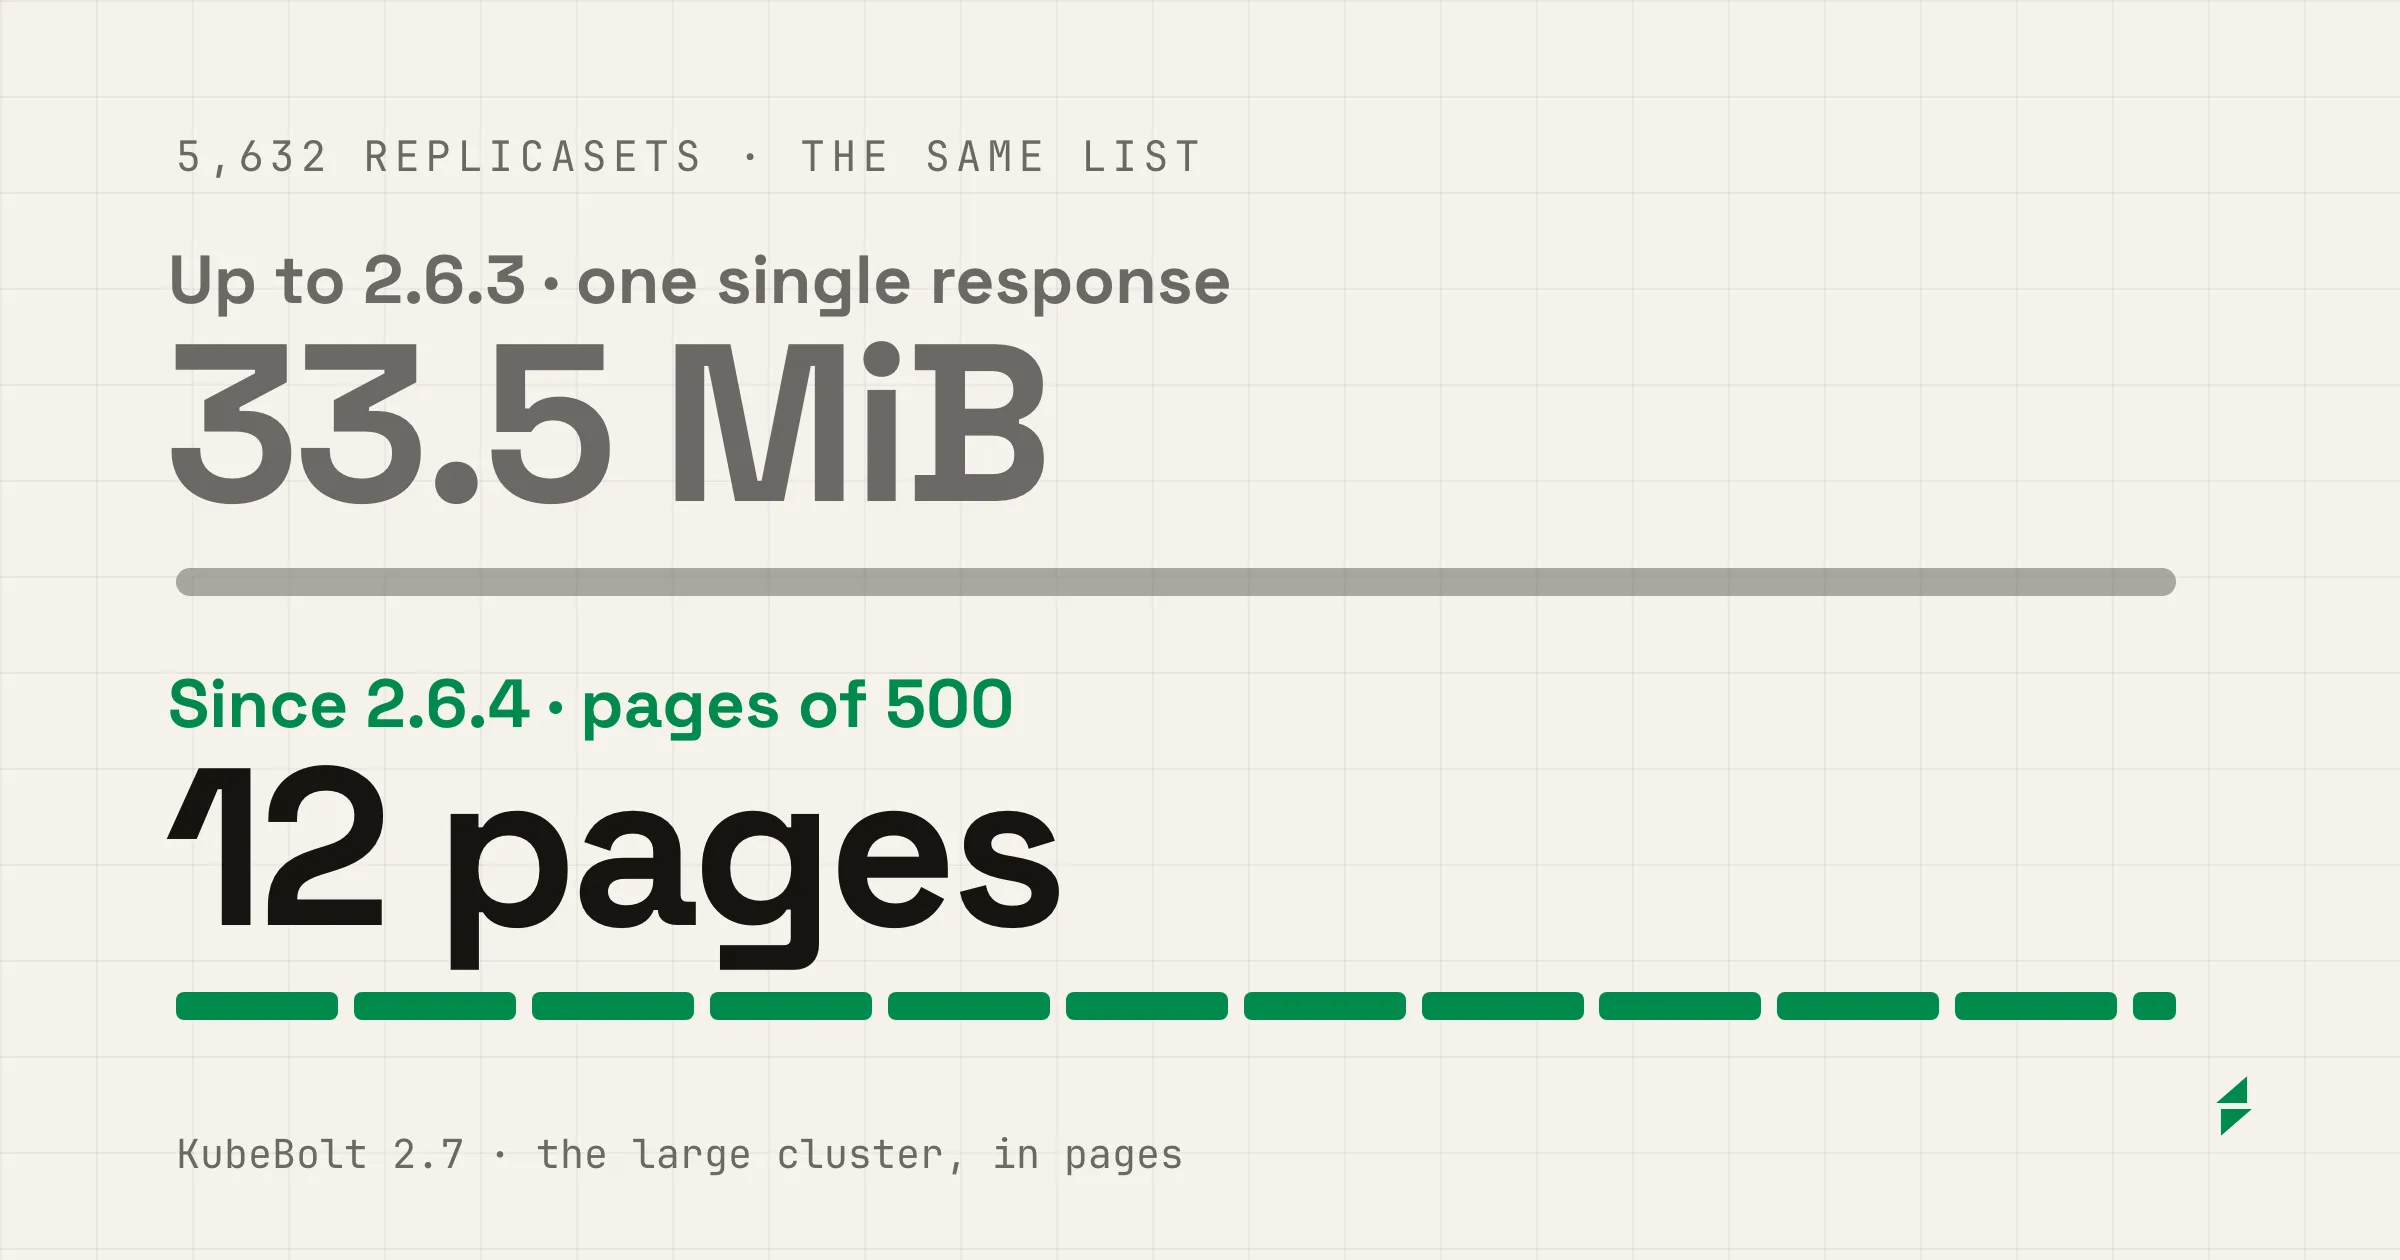
Our customer’s cluster connected through the agent, which opens an outbound channel to KubeBolt so nothing in the cluster has to be exposed. Every response from the API server crosses that channel, and the ReplicaSet list crossed it in one go: 33.5 MiB in a single response.
The cause is a Kubernetes detail. Informers ask for the list in pages of 500, but with resourceVersion=0, which lets the API server answer from its cache. From the cache, the API server ignores the page size and returns the whole collection. The agent had to hold that response in memory, twice while it relayed it, under the chart’s 128 Mi limit at the time. Kubernetes killed it for lack of memory halfway through the connect.
The ReplicaSet list of a cluster with 5,632
Up to 2.6.3 · one single response
Since 2.6.4 · 12 pages of 500, about 3 MiB each
The agent's memory during the connect
One whole response, two copies in memory
Page by page
- Since 2.6.4, the initial load asks for its pages without
resourceVersion=0, and the API server honours them. The 5,632 ReplicaSets arrive in 12 pages of 500, and each page is still served from the API server’s cache, without reading all of etcd. - In our lab, with a cluster of the same size, the agent’s memory during the connect went from 113–125 MiB down to about 64 MiB.
- Watches don’t change: changes still arrive one by one.
What KubeBolt re-read with nobody looking
With the cluster connected, we measured everything that crossed the agent’s channel, minute by minute. Two periodic reads weighed far more than they should.
The first is the copy check. Every 5 minutes, KubeBolt counts Pods, Deployments and ReplicaSets in the cluster and in its copy, to catch them drifting apart. To count, it asked for a single object and read the total from the remainingItemCount field, but it carried the same resourceVersion=0, so the API server sent back the three lists in full. On a cluster that size, that was about 40 MB every five minutes.
The second is Helm’s history. Helm stores every revision of every release as a Secret holding the whole release: the chart, the values and every rendered manifest. KubeBolt downloaded it on connect and listed it again every minute, for two insights and for the Applications page, though only a release’s detail view needs that history.
| Read | Before | Since 2.6.4 and 2.6.5 |
|---|---|---|
| Copy check, every 5 minutes | The full lists of Pods, Deployments and ReplicaSets | One object per type: 2–3 KB |
| Helm Secrets with the Overview open | 7,225 KiB a minute | 11.7 KiB a minute |
| The agent’s whole channel, at rest | 7,342 KiB a minute | 227 KiB a minute |
| Applications list, once loaded | 136 ms | 0.5 ms |
The Helm figures are from our lab, with 10 releases and 18 revisions. What the table doesn’t show is where that work landed: each of those reads also went through your cluster’s API server, and the copy check and the insights ran whether anyone had KubeBolt open or not.
Now the Secrets copy leaves Helm’s out, and their lists and counts read metadata only, once a minute. A release’s content is read when something needs it: the latest revision, once, for the Applications list or for an insight about a failed release, and the detail view reads only that release.
While it loads, you see how much is left
Up to 2.6.4, a loading cluster showed “Connecting to cluster” and nothing else. If the connect failed, there was no way to know why or when it would try again. Since 2.6.5, the loading screen shows the whole process.
- Four steps: agents connected, access checked (with the kinds the role can’t read, if any), loading the cluster, and the first health check.
- A bar that moves with the bytes, because they are what takes time to cross the channel: a ReplicaSet weighs many times what an Event does. When the load is waiting on one large collection, it names it.
- What has arrived and how fast, the time elapsed, an estimate of what is left, and a log of what happens.
- The cluster’s CPU and memory, which come from the agents’ metrics and don’t wait for the load to finish.
The way a slow connect behaves changed with the screen:
- The connect timeouts count the time with nothing arriving from the cluster. A connect that keeps receiving pages carries on for up to 10 minutes, and a stuck agent fails at the same point as before.
- When a connect fails, KubeBolt waits 30 seconds before retrying, then 1, 2 and 4 minutes, and 5 at most, and the screen says when the next attempt is. Before, every request from the portal started a new connect: in the lab, that was 710 MB in 14 minutes without ever connecting.
- If it can’t list the namespaces, it retries, and if it still can’t, it tells you which kinds are left without access. Before, it quietly narrowed itself to
default,kube-systemandkube-public.
Agent 1.4.10, with headroom
1.4.10 raises the agent’s default limits to 256 Mi of memory and 500m of CPU. Requests don’t change, so scheduling doesn’t either. A response that doesn’t fit in its memory no longer takes it down: the agent accepts responses up to a quarter of its memory limit, 63 MiB at most, and above that it answers with an error that names the cap, the limit and the value to raise, resources.limits.memory.
If an agent runs out of memory anyway, the OOMKilled and Memory Near Limit insights give you the helm upgrade that doubles it. And since 2.7, the Clusters page flags a cluster whose agent should be upgraded, with the command ready to copy.
One summary instead of hundreds of alerts
A large cluster’s first evaluation opens many insights at once. On that development cluster it was nearly 600, most of them Services with no ready endpoints, which is normal in such an environment, and each one went out as a notification.
Since 2.6.4, when a cluster opens 5 or more insights within 60 seconds, Slack, Discord and instant email get one summary once the cluster has been quiet for 30 seconds. It says how many there are of each severity, names the critical ones and lists every rule with its count and the namespaces most affected. If the burst doesn’t stop, a partial summary arrives every 5 minutes at most. In the lab, a reconnect with 502 insights left four single alerts and one summary per channel.
On screen, a cluster with many namespaces reads better too. Workloads by namespace, on the Overview, shows 12 namespaces, those that need attention first, and leaves the rest behind Show all, which says when a hidden one needs attention. The Namespaces page pages 50 at a time, counts them all and filters by name.
If you run KubeBolt yourself
Upgrade the backend to 2.7.0 and the agent to 1.4.10 in every cluster, with that cluster’s kubectl context:
helm upgrade kubebolt oci://ghcr.io/clm-cloud-solutions/kubebolt/helm/kubebolt \
  --version 2.7.0 -n kubebolt --reset-then-reuse-values

helm upgrade kubebolt-agent oci://ghcr.io/clm-cloud-solutions/kubebolt/helm/kubebolt-agent \
--version 1.4.10 -n kubebolt-system --reset-then-reuse-values--reset-then-reuse-valuesneeds Helm 3.14 or later. Don’t use--reuse-values: it keeps the previous chart’s defaults, and the agent would stay on 128 Mi.- If you raised the connect timeouts by hand to get a large cluster connected, you can set them back to their defaults.
- If the agent’s namespace has a ResourceQuota on limits, leave room for the new ones.
What changes with size
On a small cluster, you’ll notice almost none of this, apart from a loading screen that lasts a few seconds. On a large one, it decides whether the cluster connects at all. And on every cluster, KubeBolt asks your API server for a good deal less than before.