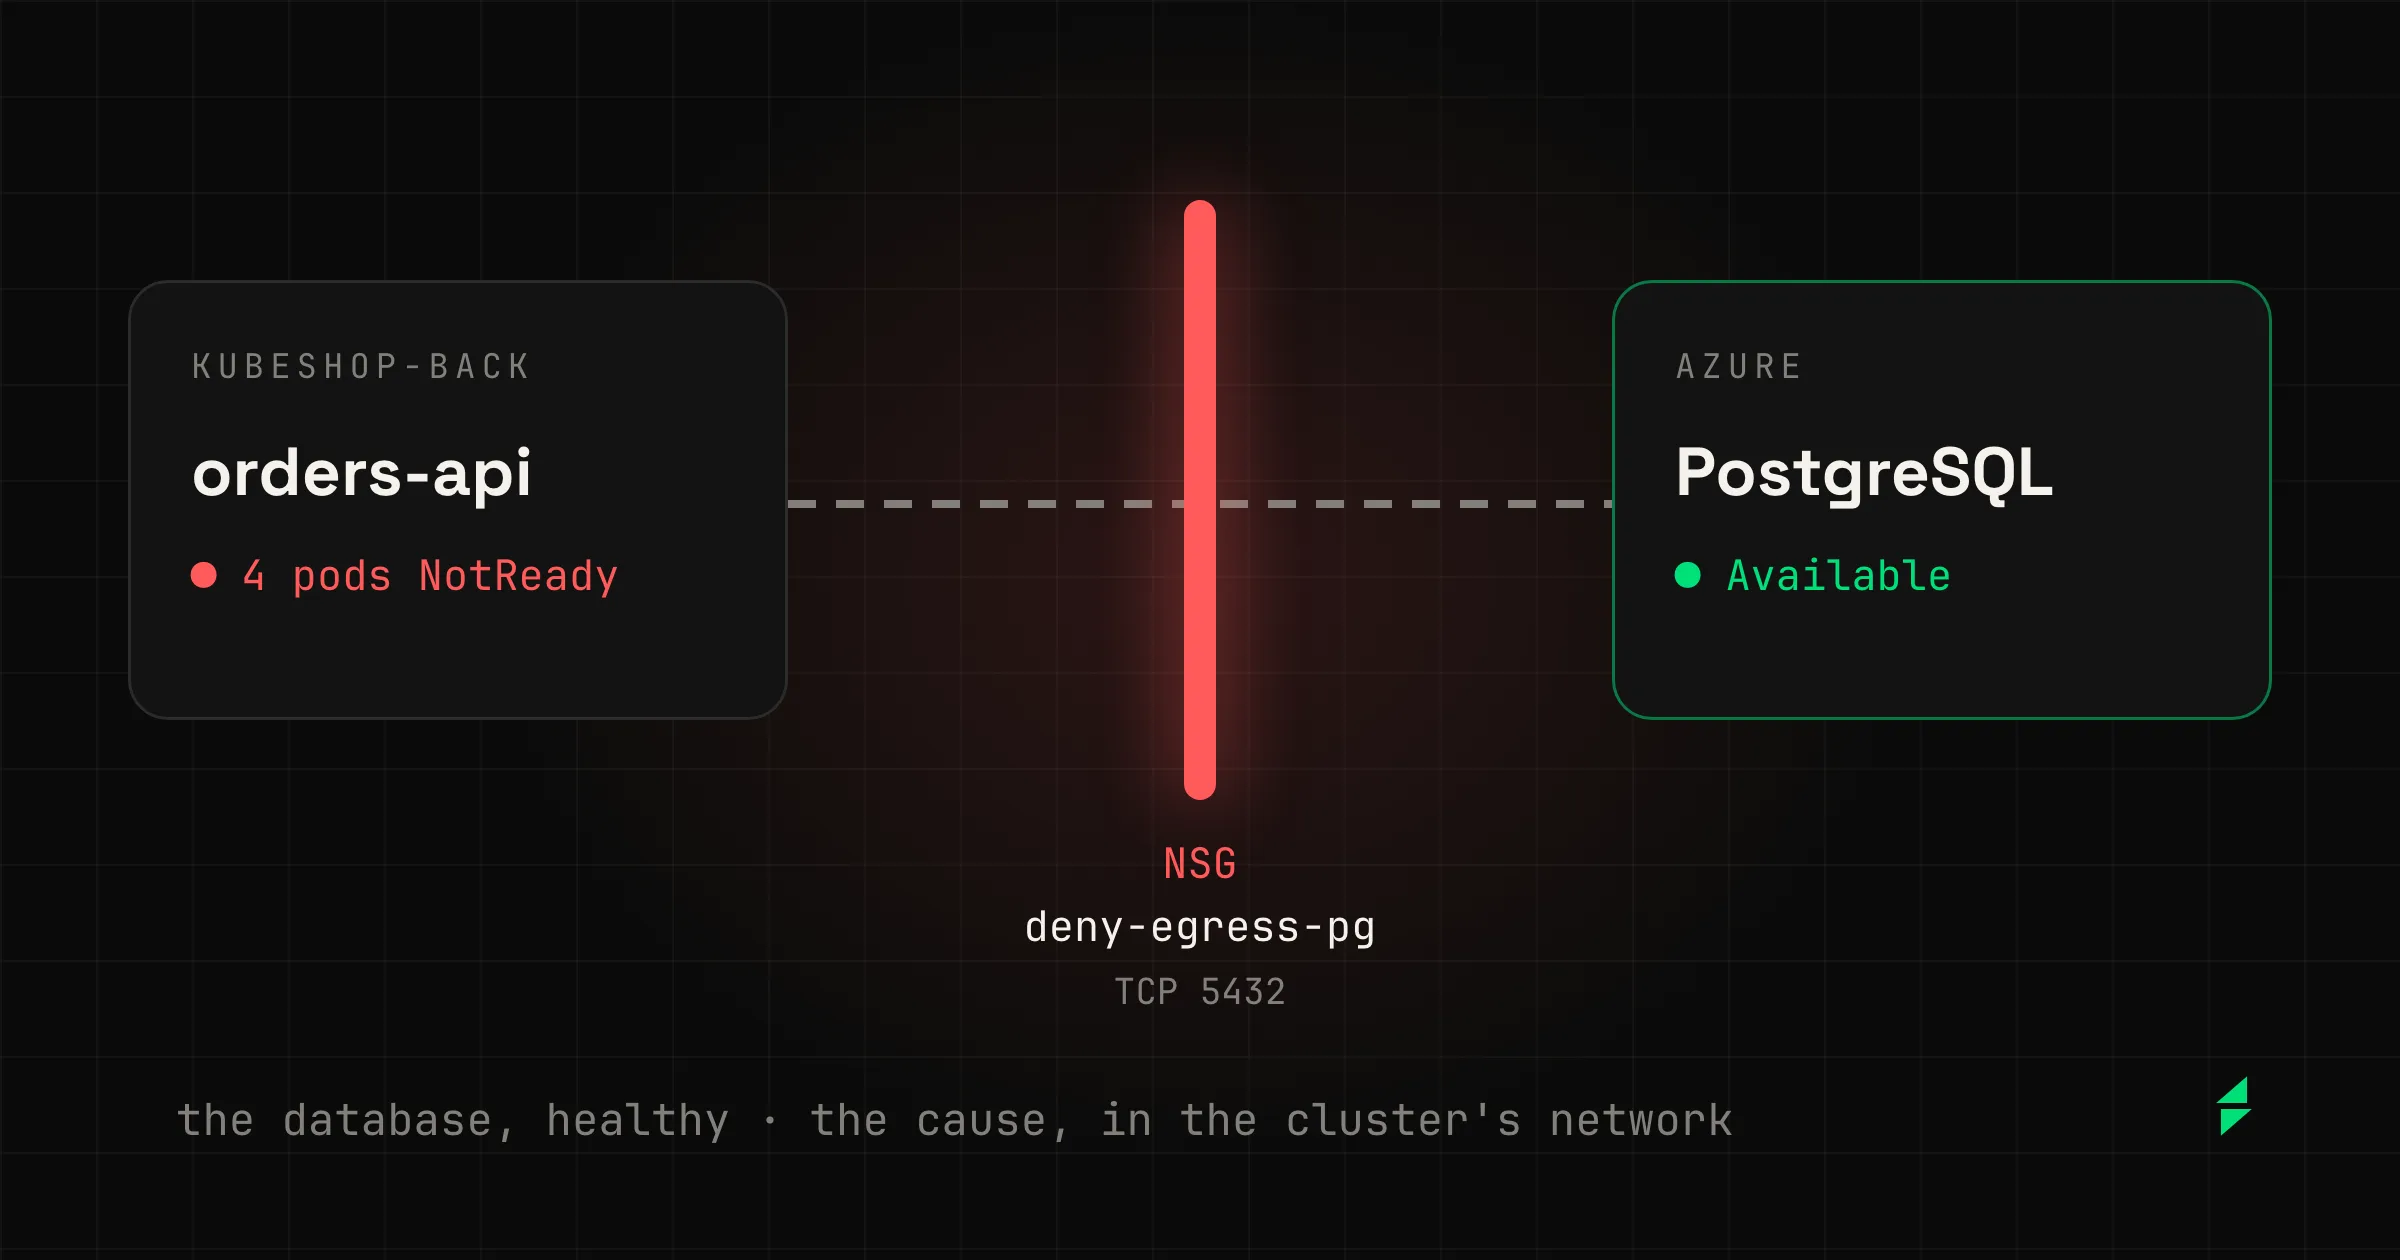
The hardest incidents to explain are the ones the cluster can’t see. The pods are Ready, the database shows as Available in Azure, and the shop returns 503. The cause sits in a network rule, a parameter or a permission, and none of that lives inside Kubernetes.
In 2.3 I wrote that we’re connecting Kobi to AWS, Azure and GCP so it can follow the cause outside the cluster. Before I let it read anyone’s cloud, I need to know whether it finds that cause, and for that I use concrete incidents and the question someone would ask at three in the morning.
The method has an unglamorous name: the exam is written before anything breaks. I set up the failure in a lab on Azure, the way it would really happen. Before asking anything, I write down what Kobi has to find and which traps it has to avoid. Then I ask the operator’s question, with no hints, and grade the answer against that list. A fix only counts once the next run shows it in the real chat.
What’s underneath, in five lines:
- The lab breaks Azure the way it breaks in real life, with red herrings from the same day.
- What Kobi knows about Azure travels in four layers, and the one that matters most arrives inside a tool result.
- The question is the operator’s, for example “The shop won’t load, what’s going on?”.
- Every answer is graded against criteria written beforehand, credits included.
- The connector can only read, and that doesn’t depend on the model behaving.
The lab
Two AKS clusters make up a shop. kubeshop-front runs the web front end. kubeshop-back runs orders-api and catalog-api, which read from an Azure PostgreSQL flexible server, outside the cluster and in another region.
An agent injects each failure the way a person would: a server parameter, an ALTER ROLE inside the database, a rule on an NSG. And there’s almost always noise around it: earlier changes in the activity log, a restart, an outage that already resolved.
| What breaks | What the cluster sees | The trap |
|---|---|---|
statement_timeout = 50: someone meant 50 seconds and it’s milliseconds | orders-api returns 500, catalog-api stays at 200 | Restarting, or inventing the previous value |
The role’s password, changed with ALTER ROLE inside the database | All fine until the next restart | The rollback and the day’s other changes |
| An outbound rule on the nodes’ NSG | Pods NotReady, the database Available | Blaming the database |
A permission revoked with REVOKE | 500 in about 30 ms | Pointing at someone with no record |
| The database in another region | About 150 ms per page | Blaming the region for the whole gap |
| An inbound rule on the NSG | Pods Ready with no traffic | Trusting the load balancer’s healthy probes |
So far everything has been tested against PostgreSQL. Azure SQL and Service Bus have scenarios ready, and the rest of the resources Kobi recognizes haven’t been tested yet.
The route of a question
Before the results, the harness: what surrounds the model so a question reaches the cause. A backend in the cluster can no longer reach its database in Azure, and the operator asks what’s going on. The arrows are Kobi’s calls, in order.
- Backend logs.
get_pod_logsreturns the error bursts, with their start and end. - The address. The Service or the pod's environment gives the database host.
- The classification.
get_external_connectionsrecognizes the resource by its domain and returns the method. - The Azure tool. Kobi calls
monitor,postgresorresourcehealth. - The filter. The gateway checks the command, pins the subscription and strips what must not leave.
- The read. The Azure MCP server queries Azure with an identity that can only read.
- The answer. Cause, who and when, and the duration measured in the logs.
The four layers
The obvious way to teach Kobi each resource is a skill per resource. The tests ruled it out: Haiku doesn’t always load a skill (one of ours it never loaded once), but it always reads a tool result. So what Kobi knows about Azure arrives at four different moments, and only the first depends on the specific resource.
The address classification
- When it arrives
- Every time Kobi follows an address out of the cluster, inside get_external_connections' result.
- What it carries
- The kind of resource (15 today, by domain), whether the organization has the connector, which tools to start with and how to investigate that kind.
“Is it down? Start with monitor_activitylog_list on the server name and top 20 (…): stop and start, failover, firewall and network changes, who made them and when. It needs no resource group (…)”
The external-dependencies guide
- When it arrives
- When Kobi suspects something outside the cluster and loads it.
- What it carries
- The general method: follow the classification, use a connector only if it's on, read the right resource's activity log.
“A load balancer's health probes come in through an allow rule of their own (on Azure, AzureLoadBalancer), so healthy backends and full probe availability do not show that client traffic gets through.”
The connector hint
- When it arrives
- Only if the organization's connector is on.
- What it carries
- How an Azure tool is called, that KubeBolt pins the subscription, and how to find a resource group without guessing.
“For a database that stopped answering, start with that activity log (…), and no config command says whether the server runs.”
Each command's description
- When it arrives
- Always, on every tool Kobi sees.
- What it carries
- What the command returns and what it doesn't, written by us instead of Microsoft's text.
“postgres_server_config_get: A server's configuration: version, SKU, location (the server's region), storage, backup retention, geo-redundancy. Not whether it is running, nor its network or firewall rules.”
Quotes are from the code.
The harness decides cost too. Kobi runs on Haiku 5.5 and moves to Sonnet 5.5 when it has to go out to the cloud. At first, just loading the guide was enough to escalate, and the front side cost about 49 credits per test without touching Azure. It now escalates on what the classification finds, and that side costs 3 or 4.
The exam is written first
The criteria change with each scenario, but there’s a common base. The cause, with the value and the time. Who made the change, if a record says so. The remedy at the right layer: if an NSG rule is to blame, restarting pods doesn’t count. The scenario’s traps. Nothing made up. And how many calls and credits it took.
Writing it down first matters because a Kobi answer almost always sounds right. With the list in front of you, you see what’s missing.
We ran the first scenario in the table twice, 17 days apart. On October 12, Kobi found the cause, the author and the time in 57 seconds, following the error from the front cluster to the back one and from there into Azure. Here’s how it compares with September 25, counting the fixes from that same day:
| Criterion | Sep 25 | Oct 12, with the fixes |
|---|---|---|
| Cause: parameter, value and time | Yes | Yes, plus the day’s three changes |
| Who made the change | Didn’t name them | Names them, from the activity log |
| Server region | Made up, the cluster’s | Claims none |
| Value to go back to | 250–500 ms, as if it were the previous one | Finds it: “Leave it at 0” |
The whole test cost 100 credits (about $0.50) on the first run of October 12, and 90 with the fixes.
The previous value was in Azure’s activity log, but it didn’t fit in what one tool can hand the model:
An agent’s answer almost always sounds right. That’s why the exam is written before anything breaks.
One case, end to end: the rule you can’t see from inside
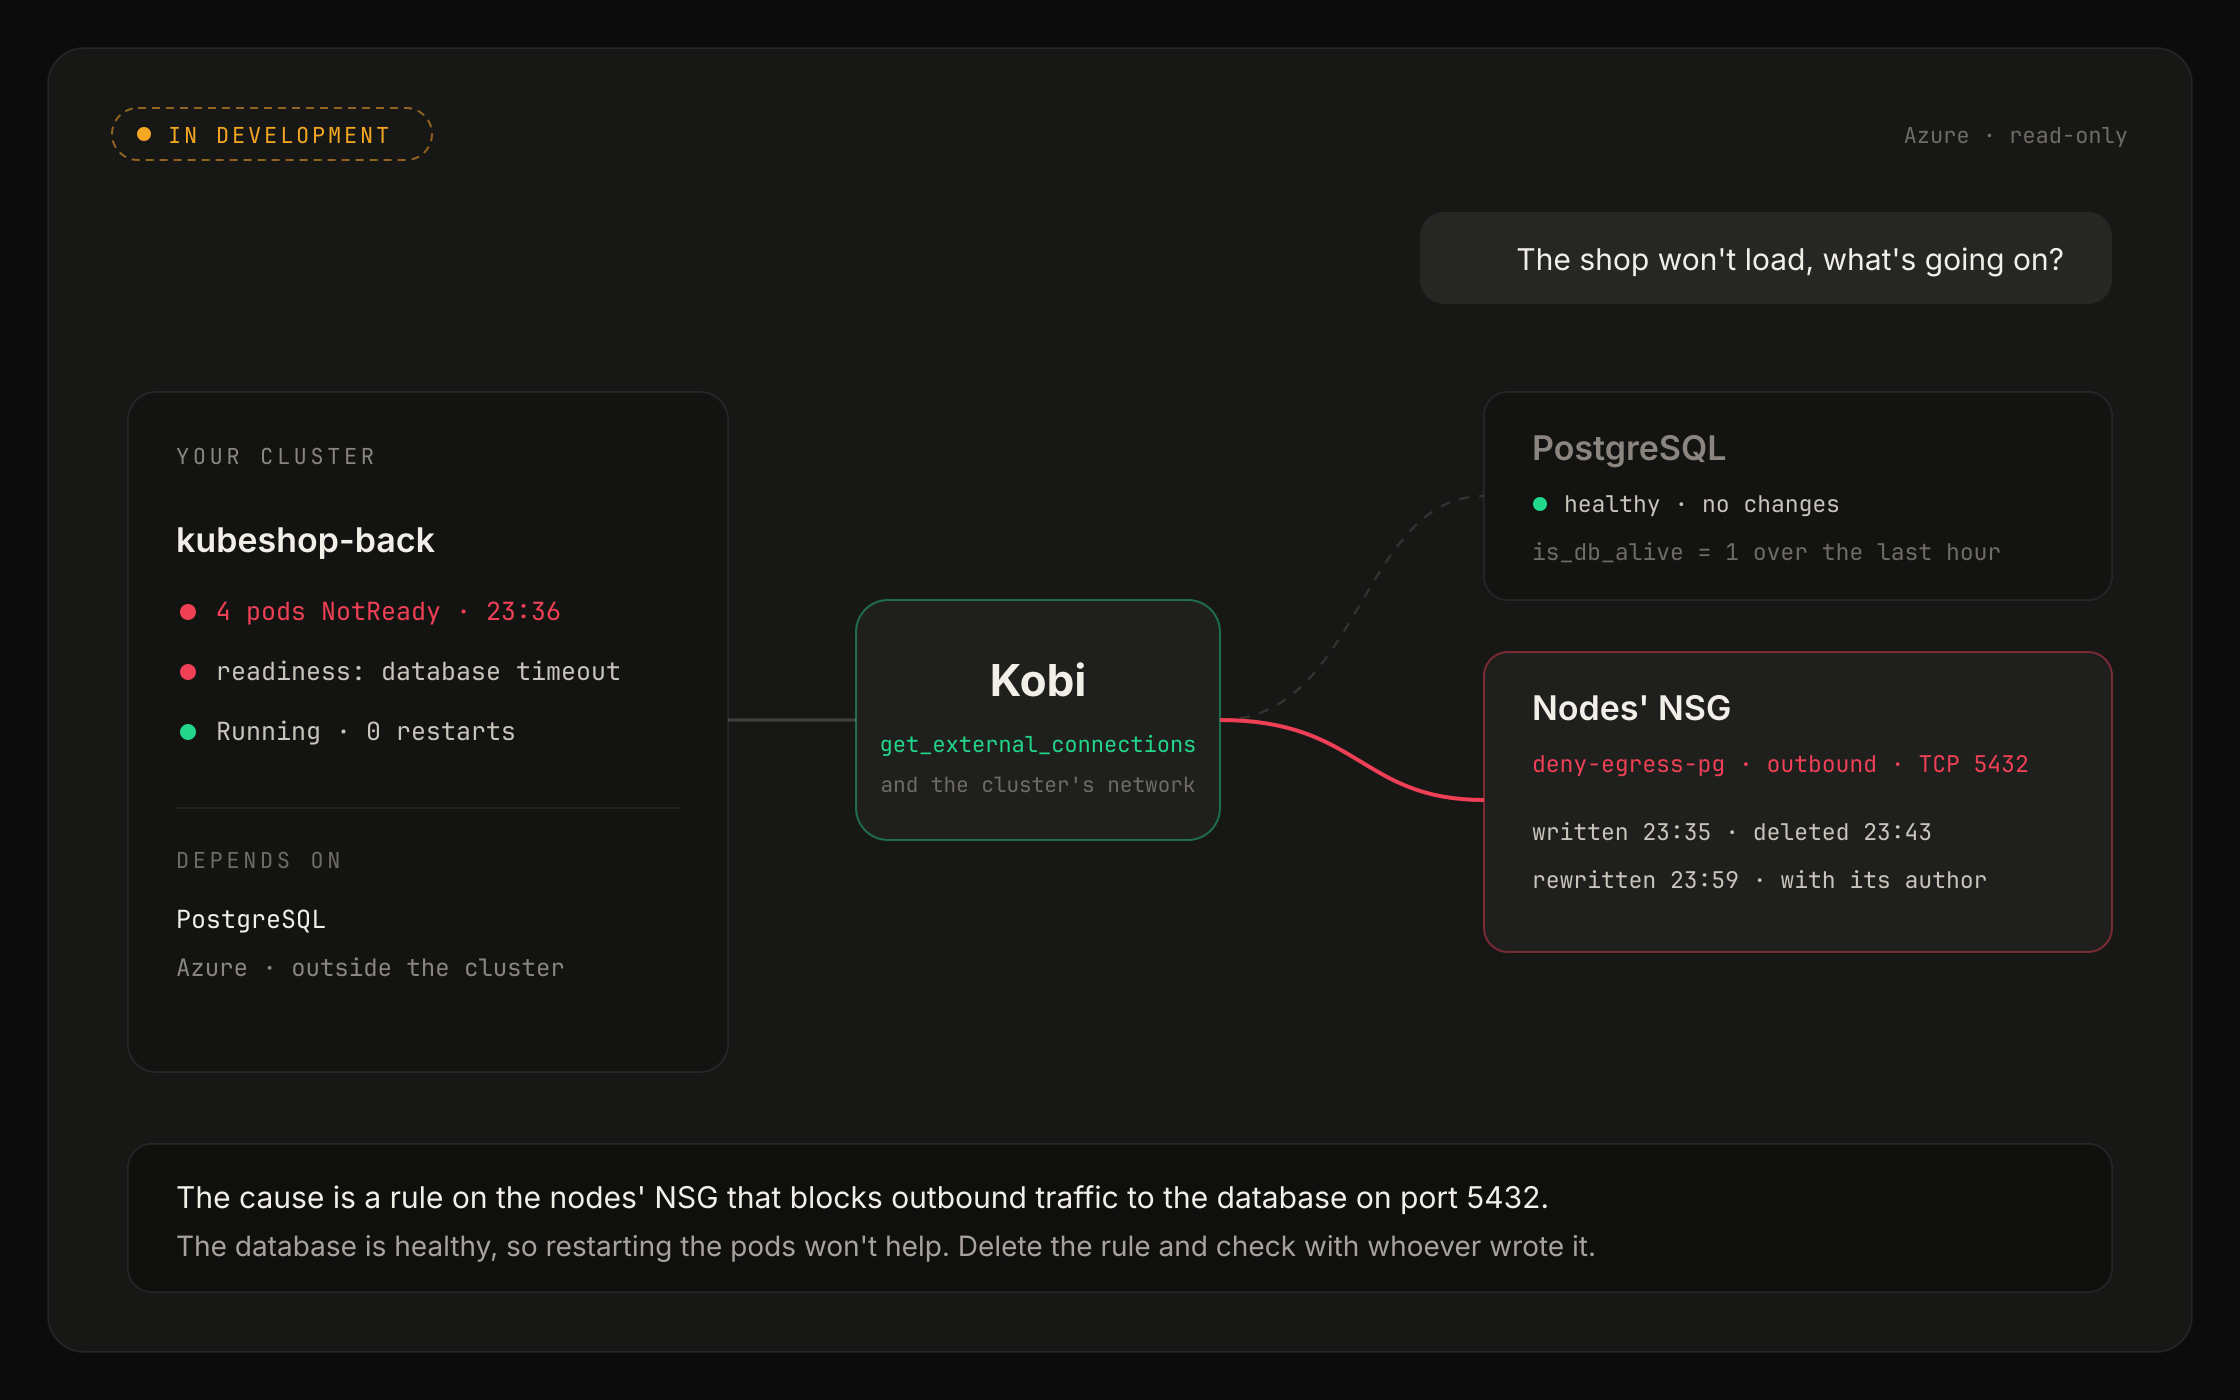
Someone adds a rule to the NSG on the network of kubeshop-back’s nodes: deny outbound TCP to the database on port 5432. The database stays Available and its firewall untouched. The backend’s readiness probe opens a connection to the database, times out, and all four pods go NotReady. The whole shop returns 503, and the database sees nothing because the traffic never reaches it.
The question was “The shop won’t load, what’s going on?”.
On both runs, Kobi rightly ruled out the database. The difference is how it spent its five Azure calls:
- 1 Database activity log Empty: the database didn't change
- 2 Database metrics The series ends before the failure
- 3 Group list The whole account
- 4 The database's group The database was already known
- 5 The tunnel's group A red herring
Stops at "something on the network path". The rule only comes with a second question.
- 1 Database activity log Empty again
- 2 Database metrics Alive in all 13 samples
- 3 Group MC_… of the nodes The cluster's network
- 4 NSG activity log The rule, its author and its time
- 5 Unused
The rule in the first answer, with both of its writes and the deletion in between.
On the first run, Kobi didn’t know where its own cluster’s network lives, even though the nodes say so in their labels, and it listed the account to find it. The fix wasn’t more calls: the classification now hands over that network group when Kobi follows an address into Azure, and the guide covers traffic in both directions. With the rule in front of it, Kobi proposed deleting it and checking with whoever wrote it, and explained why the pods were still Running: it read the server’s code, where readiness touches the database and liveness doesn’t.
On October 10 we had tested the other direction, a rule that cuts inbound traffic from the internet to the load balancer. It ended in a back-and-forth between the two clusters, with Haiku and with Sonnet, and nobody read the NSG’s log. With the same fix, the rule, its author and its time came out in the first answer.
That case leaves an idea that holds outside the lab: Ready doesn’t mean reachable. The kubelet runs readiness from the node itself, and the load balancer’s probes come in through an Azure rule reserved for them. Neither crosses the new rule, so inside the cluster everything stays green, and the only signal is that the logs go quiet.
Read-only by construction
The harness’s last layer asks nothing of the model. These are rules KubeBolt’s gateway applies before a call leaves for Azure:
- Azure commands the gateway lets through
- 48
- that can write
- 0
- kinds of resource Kobi recognizes by address
- 15
- Read-only, twiceThe Azure server starts in read-only mode, and the gateway also rejects any command whose name ends in a write verb.
- A pinned subscriptionEvery call goes to the connector's subscription. An identifier that tries to leave it is rejected.
- No data, no secretsSecret values, database queries, Storage blobs and Cosmos items stay out, even when Microsoft marks them as reads.
- Never inside the databaseThe database user and password are stripped from every request. KubeBolt works at the server level.
- No KQL hopsA query can't reach another workspace or the Resource Graph.
- An identity that only readsA service principal with read roles: Reader, Monitoring Reader and Log Analytics Reader.
- No memoryThe server listens locally only, sends no telemetry and keeps no cache: "has it recovered?" never reads a stale answer.
- Per organizationThe connector is enabled per organization, and every call goes to its audit log.
When the cause is in Azure, Kobi gives you the command to fix it but doesn’t run it.
What still goes wrong
The list of gaps these tests produce has quite a few more entries than I’m telling here, some fixed and some open. Here’s one of the ones that worry me least.
With the revoked permission, Kobi rightly said nobody can know who revoked it, because a REVOKE doesn’t go through Azure and the lab’s server doesn’t keep its statements. But it then offered the author of the network rule from an hour earlier as the “most likely contact”, based on a coincidence that wasn’t even true. The rule we’re proposing is short: who made a change is known only from that change’s record.
What it isn’t yet
The connectors are in development and have no date. Azure is where we test first. Today the connector runs as a server next to the API, meant for self-hosted installs, and the KubeBolt Cloud mode, with each organization’s own identity, is designed but not built.
What’s left
An agent that investigates incidents is only as good as the incidents you break for it on purpose. The method is short to tell: I break something the way it really breaks and ask Kobi an operator’s question. What decides whether the answer is any good is the list I wrote before starting, along with the credits it took to pass it.
When the connectors ship, they’ll ship with this lab behind them, and with every scenario we add until then.