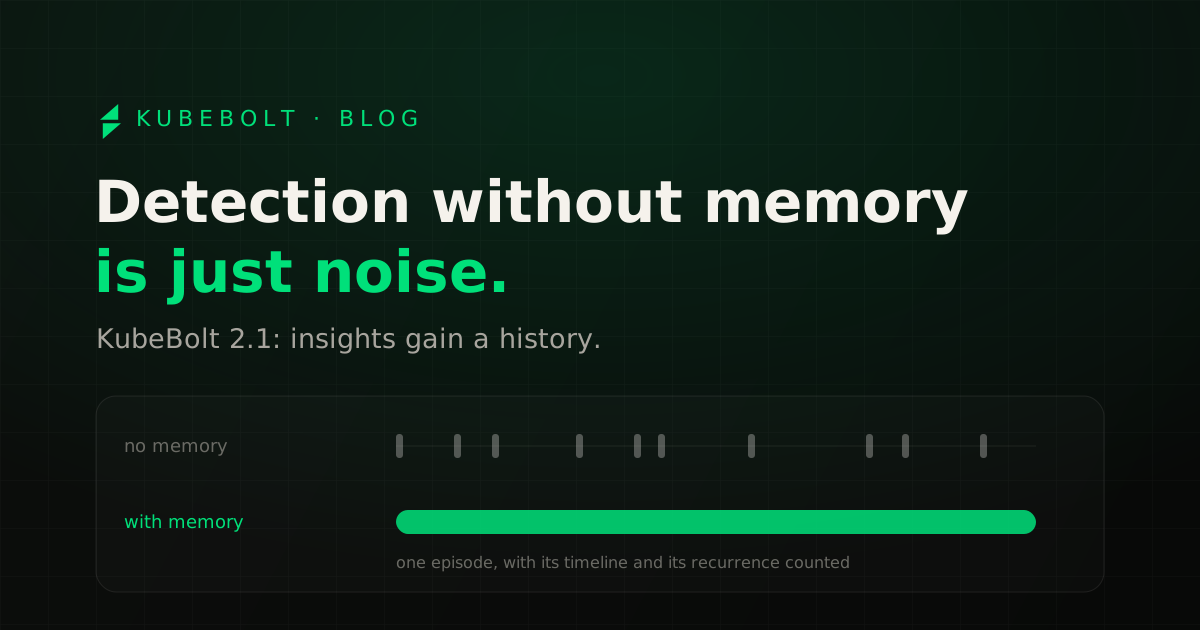
There is an enormous difference between a product that detects and a product that remembers, and almost nobody notices it until they have lived with the first kind for a few months.
A detector shows you a light. The pod enters a crash loop, the light comes on. The pod recovers, the light goes off. Three weeks later somebody asks in a meeting whether that thing with payments-api is normal, and the honest answer is that nobody knows. It might have happened once. It might have been happening every Tuesday since the June rollout. The light stores nothing, so the system’s memory is whoever happened to be looking.
KubeBolt 2.1 is the release where that stops being true. Seven versions separate this work from the last email, and most of them were tuning and hardening. The leap sits on one simple idea: a detection is not an event, it is the beginning of a story.
What that brings, in five lines:
- Every detection opens a durable episode, with its own timeline and its recurrence counted.
- Home gives you a shift report of what happened while you were away.
- Rules are tuned per environment class, and what you switch off keeps being counted.
- Silences carry an expiry and a written reason, and land in the audit trail.
- The product declares its own gaps when it was mute.
Plus one improvement that will probably pay for somebody’s month: agent 1.4.0 takes a real cluster’s active series from 437,000 down to 145,000.
A blinking light is not a signal
Detection without memory isn’t a philosophical problem, it’s an operational one, and it shows up at three specific moments.
- The handover. You come in at nine in the morning after a night you didn’t see, and the dashboard is green. Does that mean nothing happened, or that something happened and recovered on its own? A status panel can’t distinguish those two cases, because all it knows how to describe is now.
- The review. You want to decide whether it’s worth two days of work to fix the root cause of something, and for that you need to know how many times it has happened. With no history, that conversation gets settled with anecdotes: “it happened to me the other day”, “I think it’s getting worse”. That’s not a basis for prioritising.
- Noise. When a rule annoys you, the only tool usually available is to turn it off. And turning it off also destroys the information about how often it would have fired, so you never learn whether you were right to silence it or whether you just stopped looking at something that got worse.
All three are fixed by the same thing: giving every detection an identity that outlives the blink.
An episode, not a light
In 2.1 every insight opens an episode: a durable row with its full timeline, instead of a boolean flipping value.
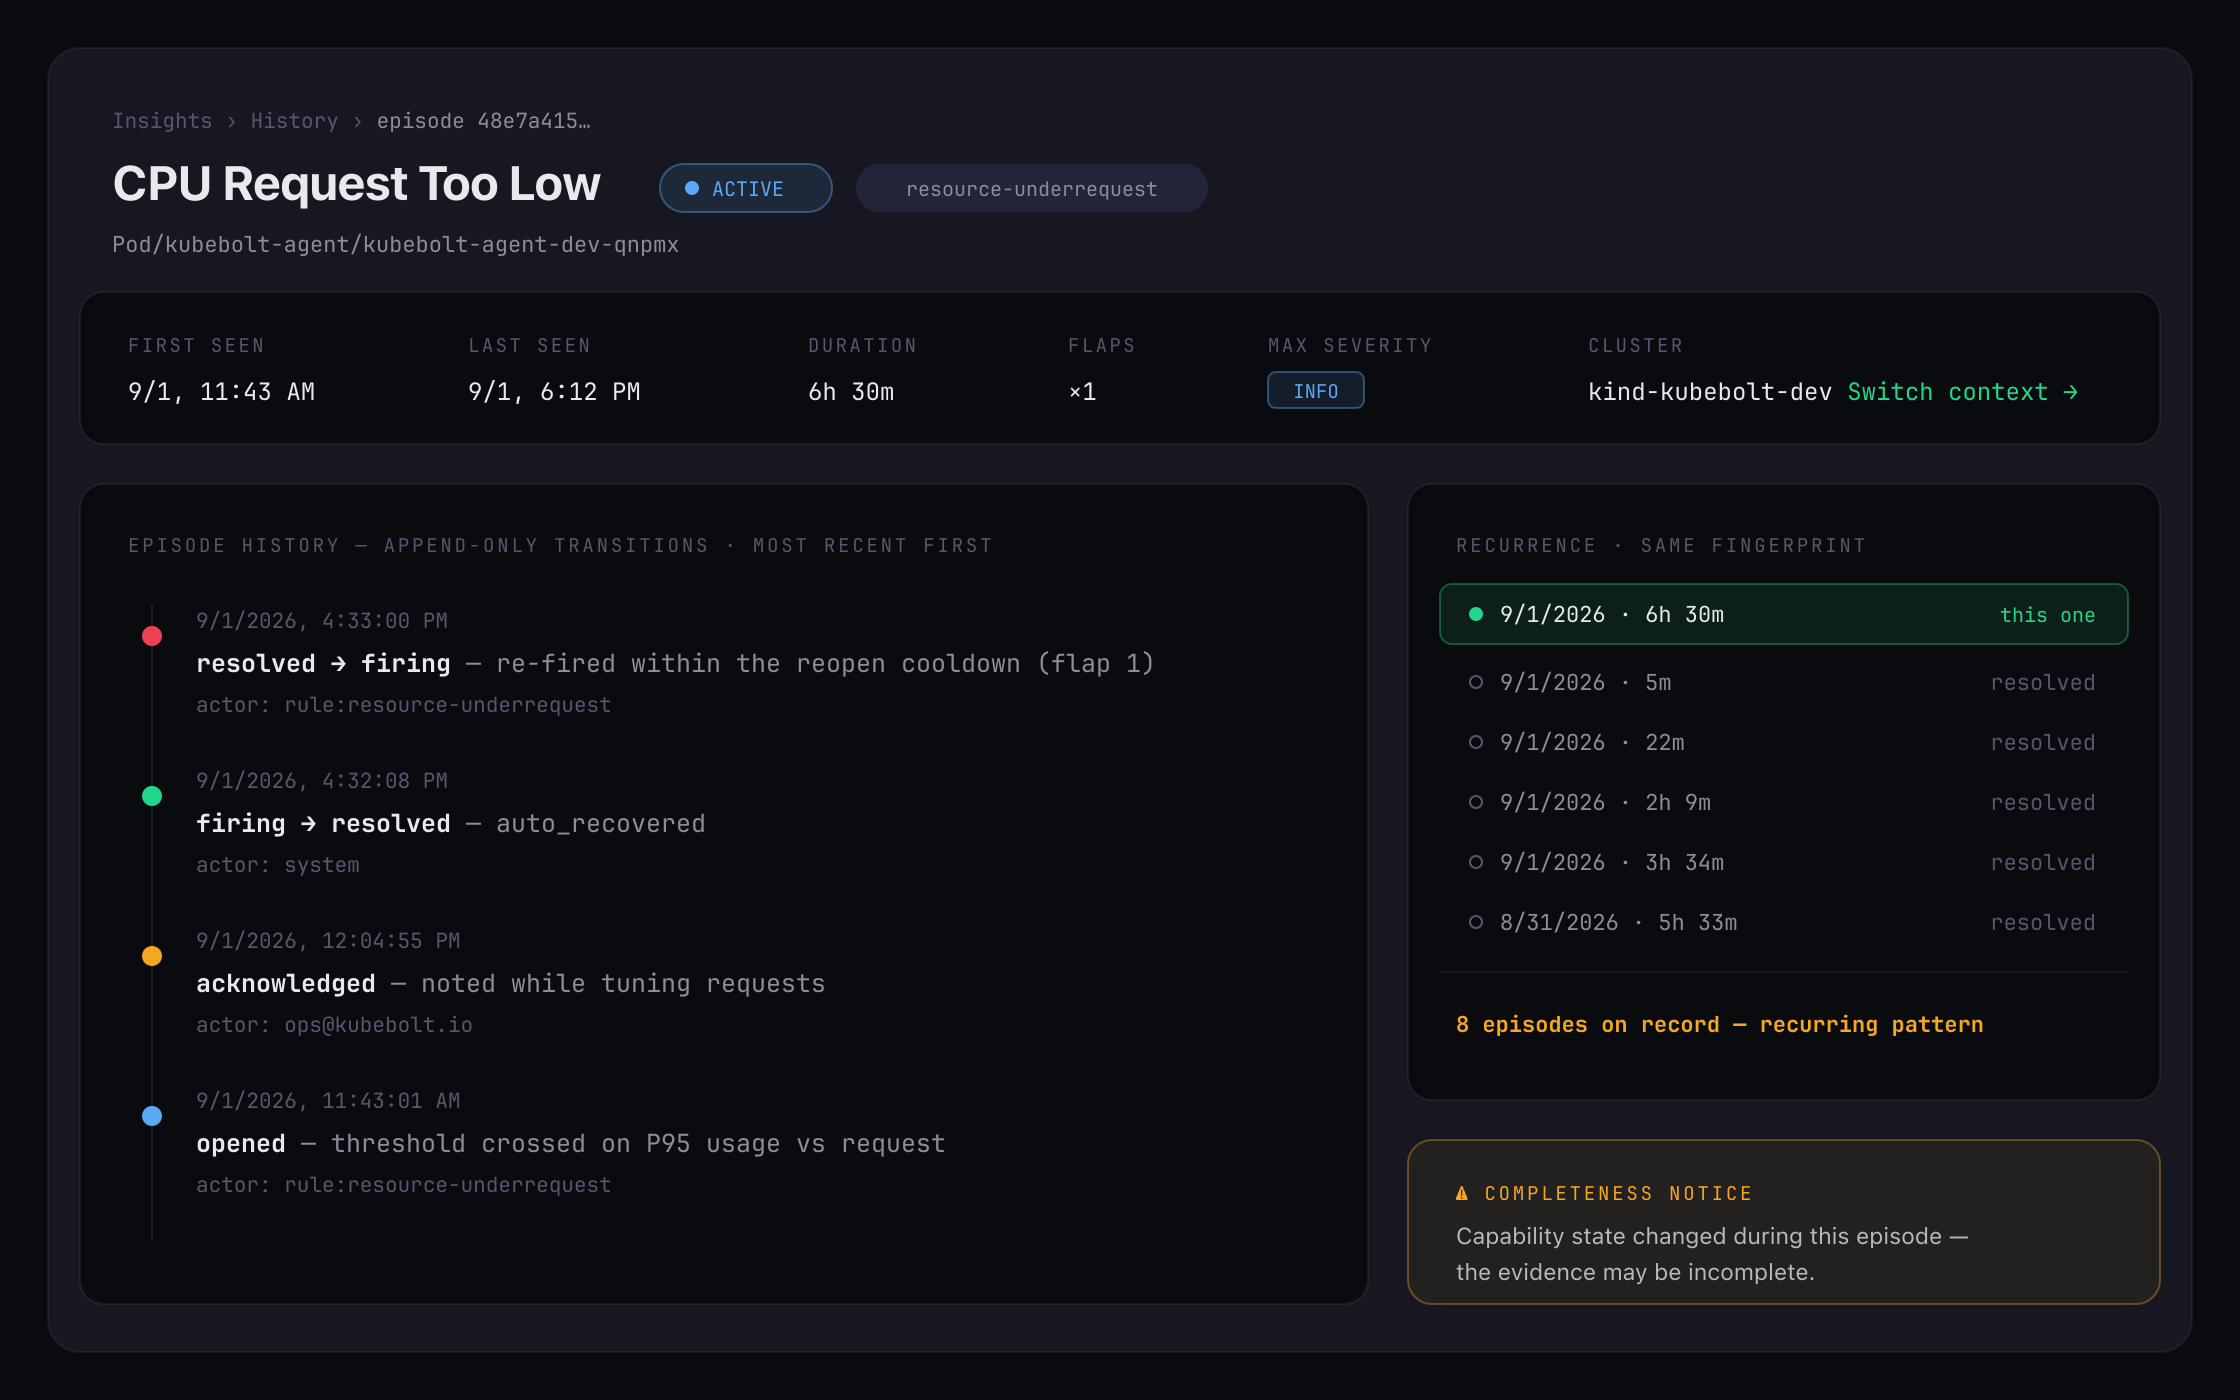
The timeline is append-only. Opened, acknowledged, silenced, resolved, expired. Every transition is written with its timestamp and never overwritten, so the episode can be read whole afterwards, not only while it is alive. There’s flap damping so a bouncing pod doesn’t generate forty episodes, and a watcher that closes by expiry what stopped making sense.
On top of that sits the thing that really changes conversations: recurrence by fingerprint. When the same problem comes back it doesn’t open an orphan episode; it’s counted against the previous ones. The view says it in plain words: “8 episodes recorded: recurring pattern”. That turns a suspicion into a number, and the question in the meeting moves from “is this normal?” to “do we fix the cause or keep absorbing it?”.
History gets its own tab, with server-side filtering and pagination, and whatever retention your plan carries. And there’s a detail we’re particularly pleased with: if a product capability changed during an episode, the evidence declares it. A completeness notice tells you that stretch may be incomplete, rather than handing you a story with holes in it as though it were whole.
You log in, and the product debriefs your absence
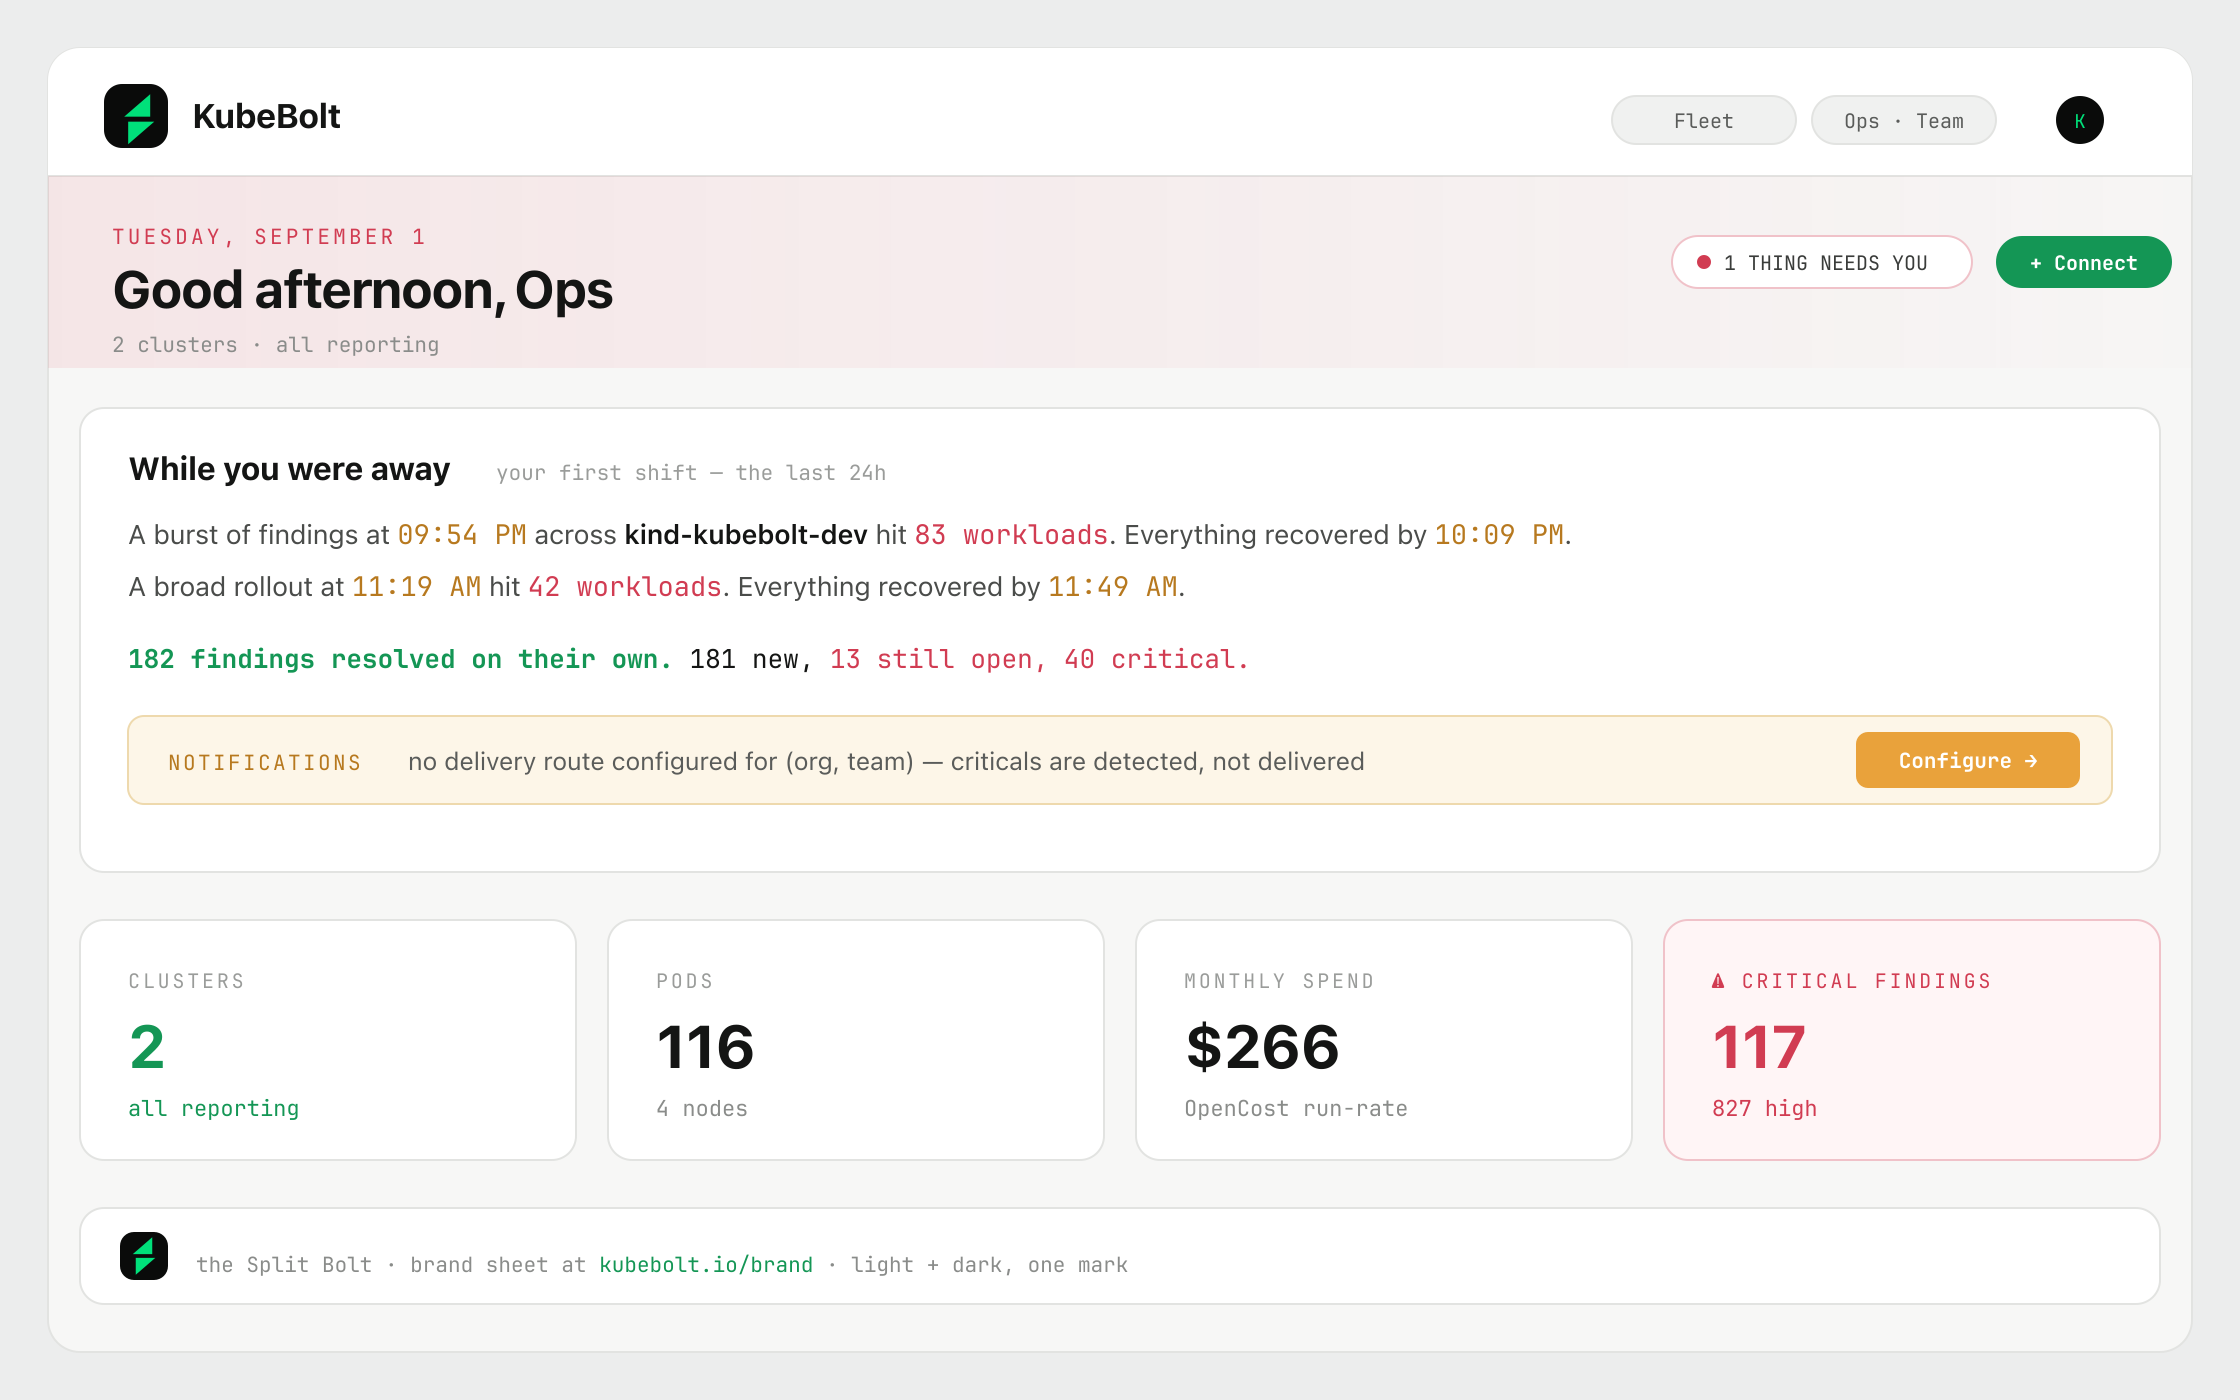
The Home greeting stopped being decorative. It’s now a shift report of what happened while you were away.
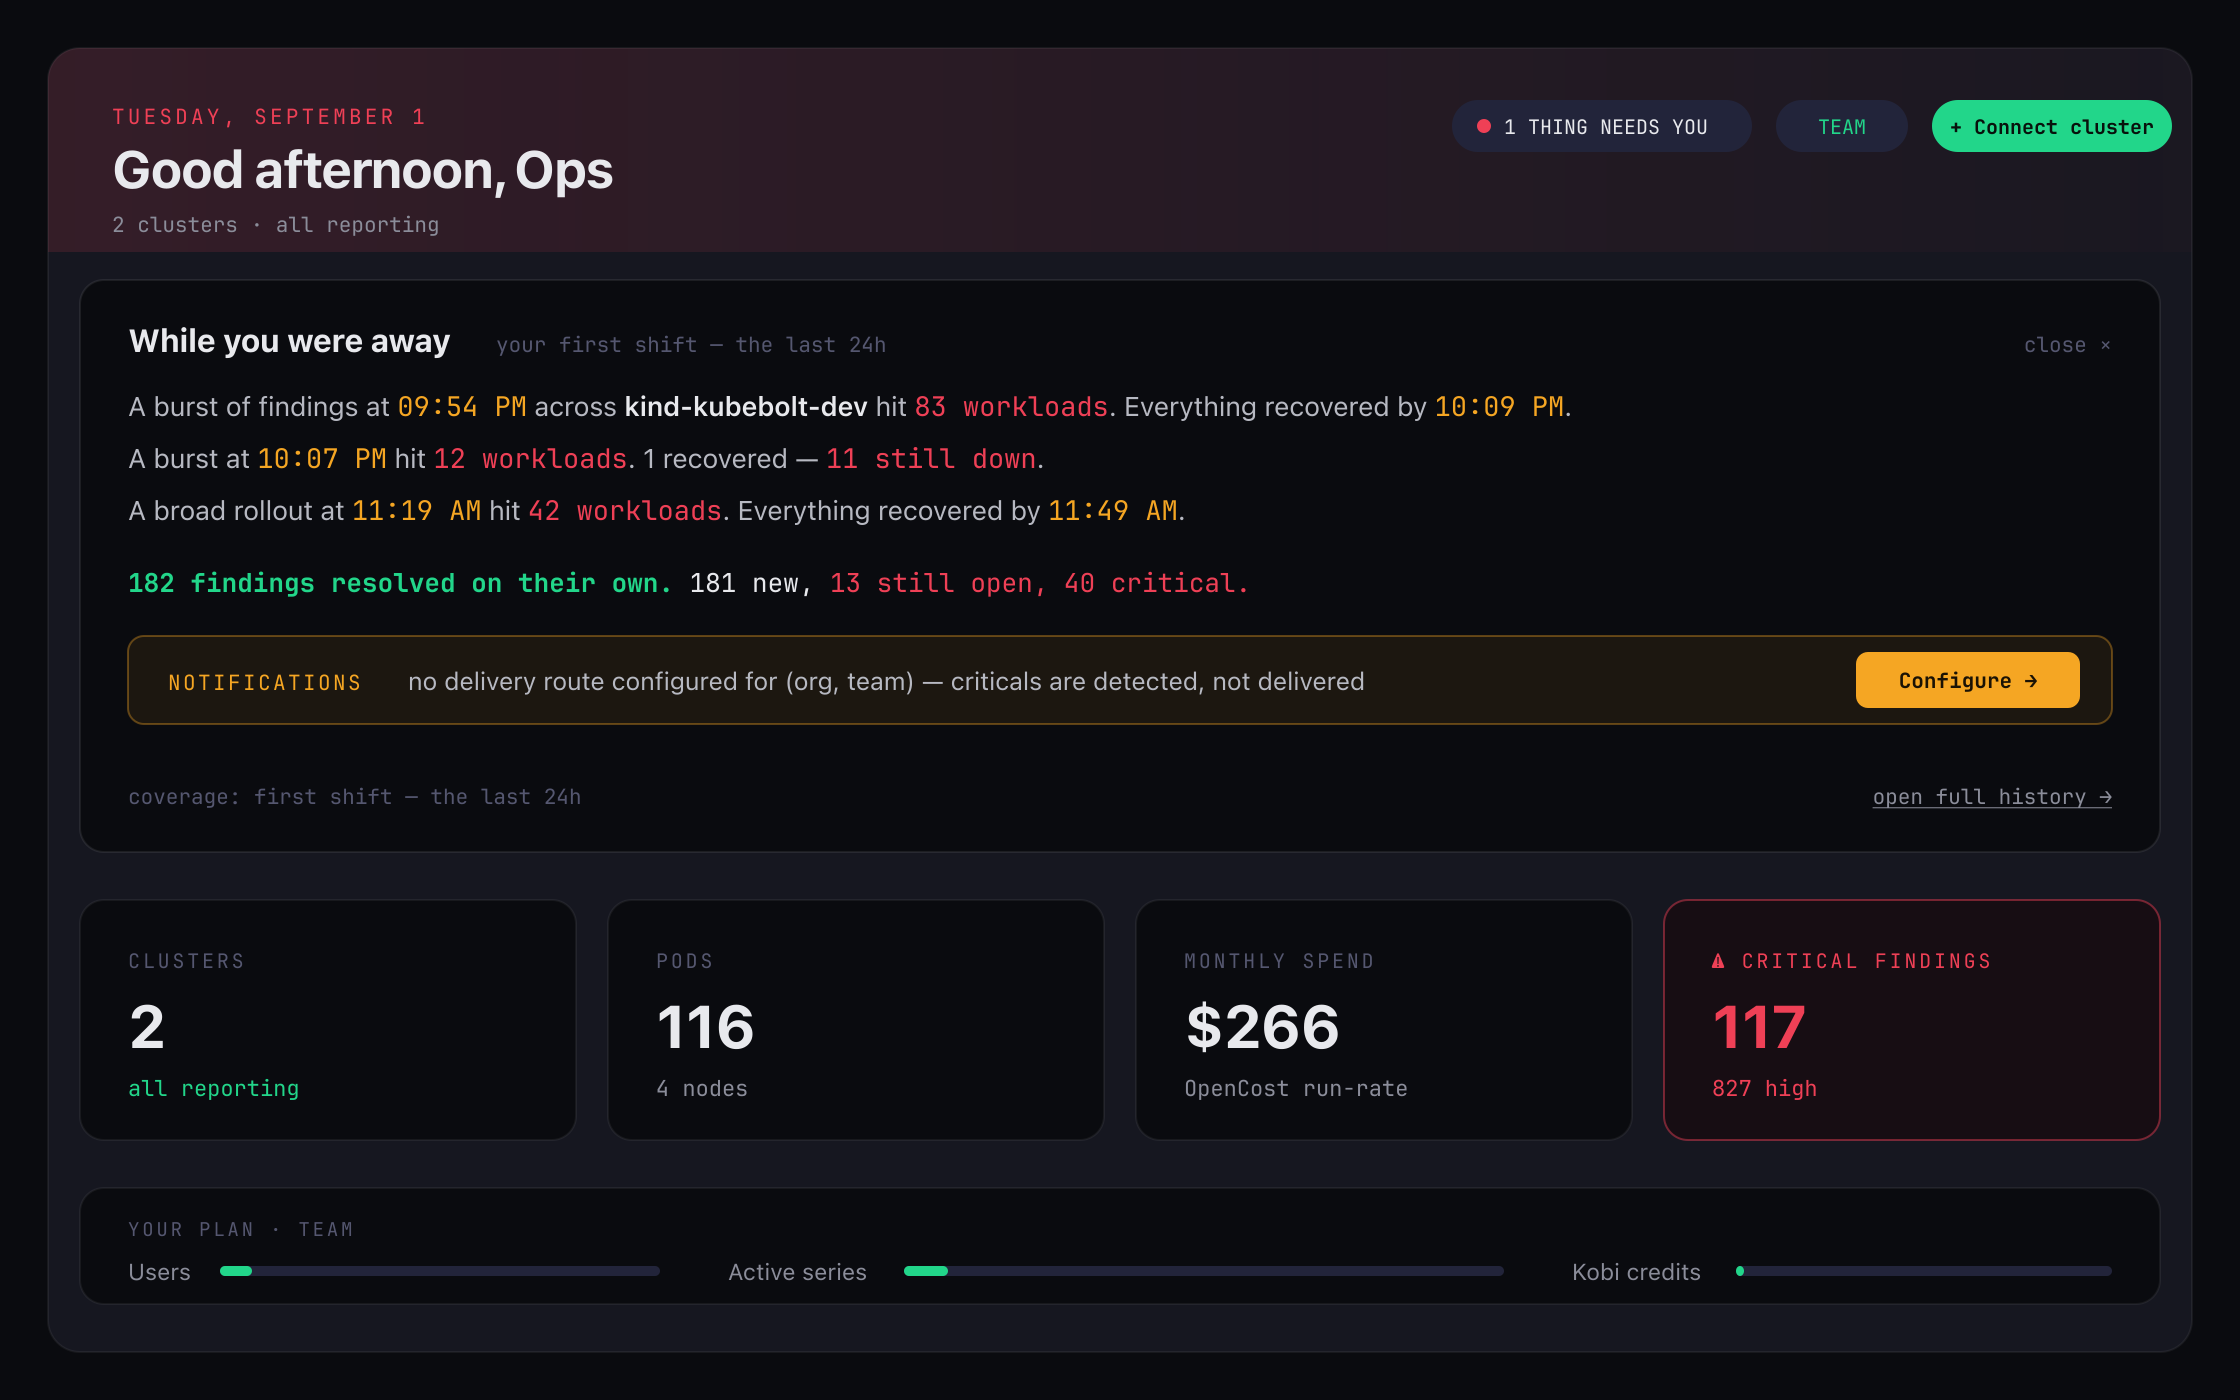
It isn’t a list of findings. It’s a narrative: what hit, how many workloads, at what time, what recovered on its own and what is still down, with the worst episode linked so you can go straight there. The clustering is deterministic, so the same time window always produces the same story; it doesn’t depend on when you open the page.
What we like best about this piece is what it does when there’s nothing to report: it stays quiet. If nothing happened while you were away, it doesn’t fill the space with status metrics. A report that always says something stops being read within a week.
Tune the expectation, not the volume
This is where 2.1 gets opinionated. Rules split into two families that are governed differently, because they don’t mean the same thing.
| Malfunction | Expectation | |
|---|---|---|
| What it is | Something broken: a crash loop, an image that won’t pull | Something you define: how many replicas, what latency |
| Severity | Fixed | It’s the dial |
| What you tune | The threshold | Severity, switching off included |
| Can it be switched off? | No | Yes |
A crash loop doesn’t stop being a problem just because you decided so, which is why its severity isn’t yours to move. An expectation is yours to set, which is why turning it off is a legitimate option.
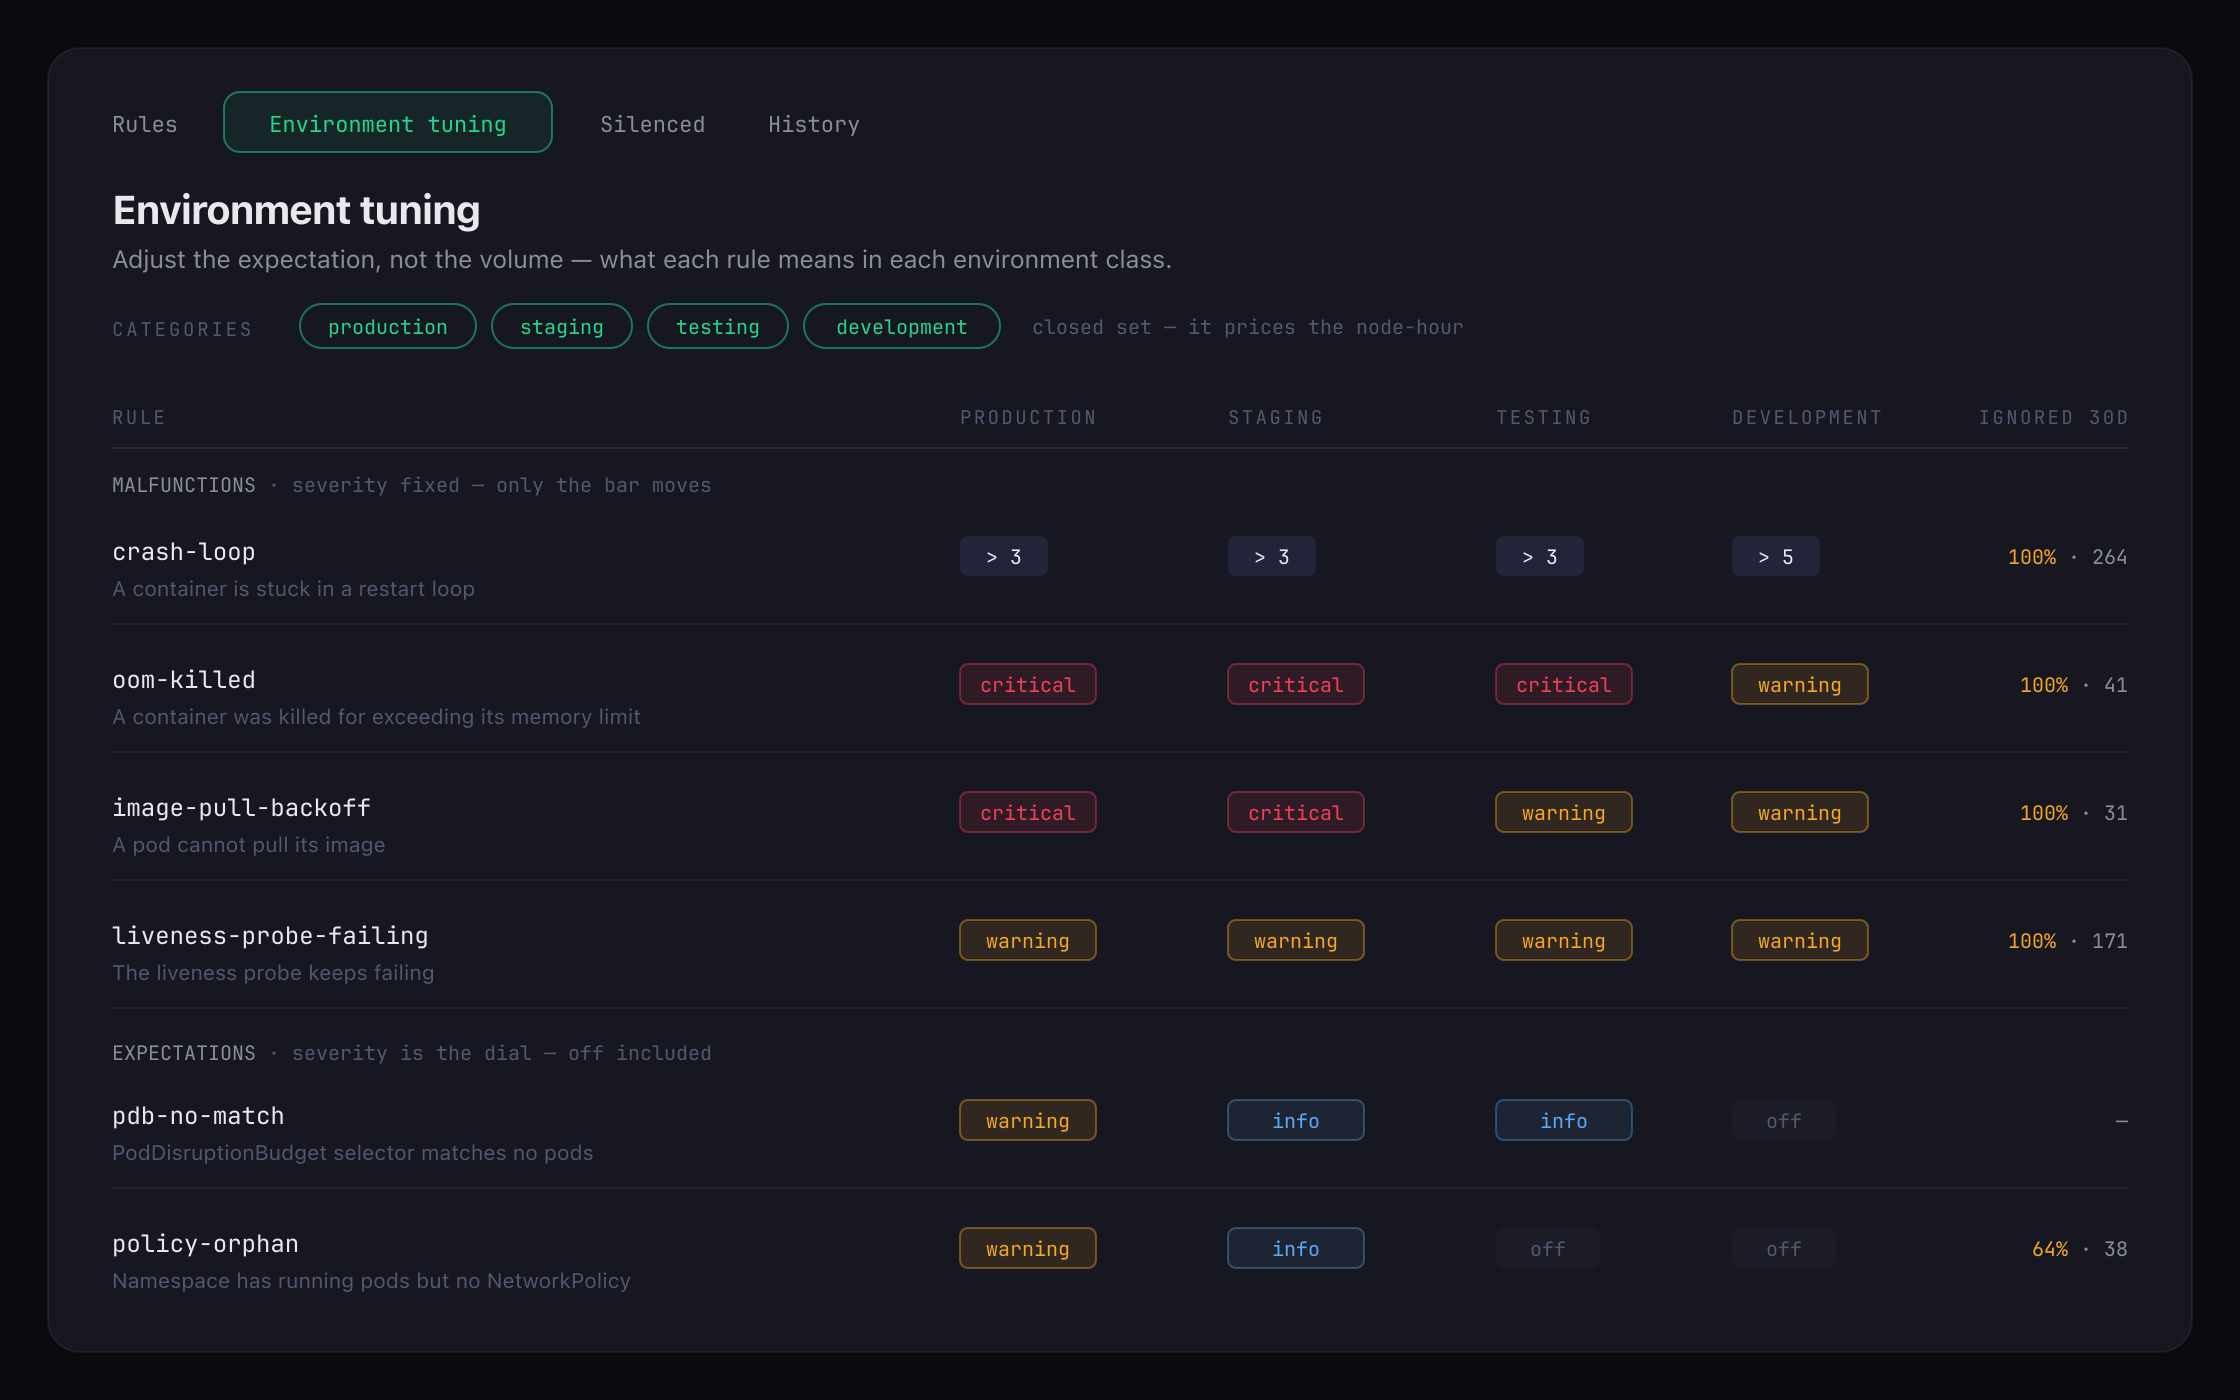
The environment matrix sits on that distinction. Layers resolve per cluster: the environment class beats the global adjustment, and the global adjustment beats the factory default. Production, staging, testing and development can hold different expectations for the same rule, which is exactly how the head of whoever operates them already works.
And then there’s the column that took us longest to settle and that we’re happiest with: “Ignored 30d”. What you switch off keeps being evaluated and counted. The view tells you how many insights that adjustment is hiding, with the button to undo it right there. Turning something off stops being a leap in the dark and becomes a decision with feedback.
Silences are first class: per cluster, rule and resource, always with an expiry or until-resolved. A permanent mute demands a written reason, criticals cut through them, and everything lands in the timeline and the audit trail with a name attached.
An anonymous, eternal silence is a debt somebody pays at 3am.
The product tells you when its own voice is off
The most uncomfortable question a customer can ask is “why didn’t I hear about this?”. The answer is almost always boring: notifications had no route configured, Autopilot was off, or the organisation had been over a cap for two weeks.
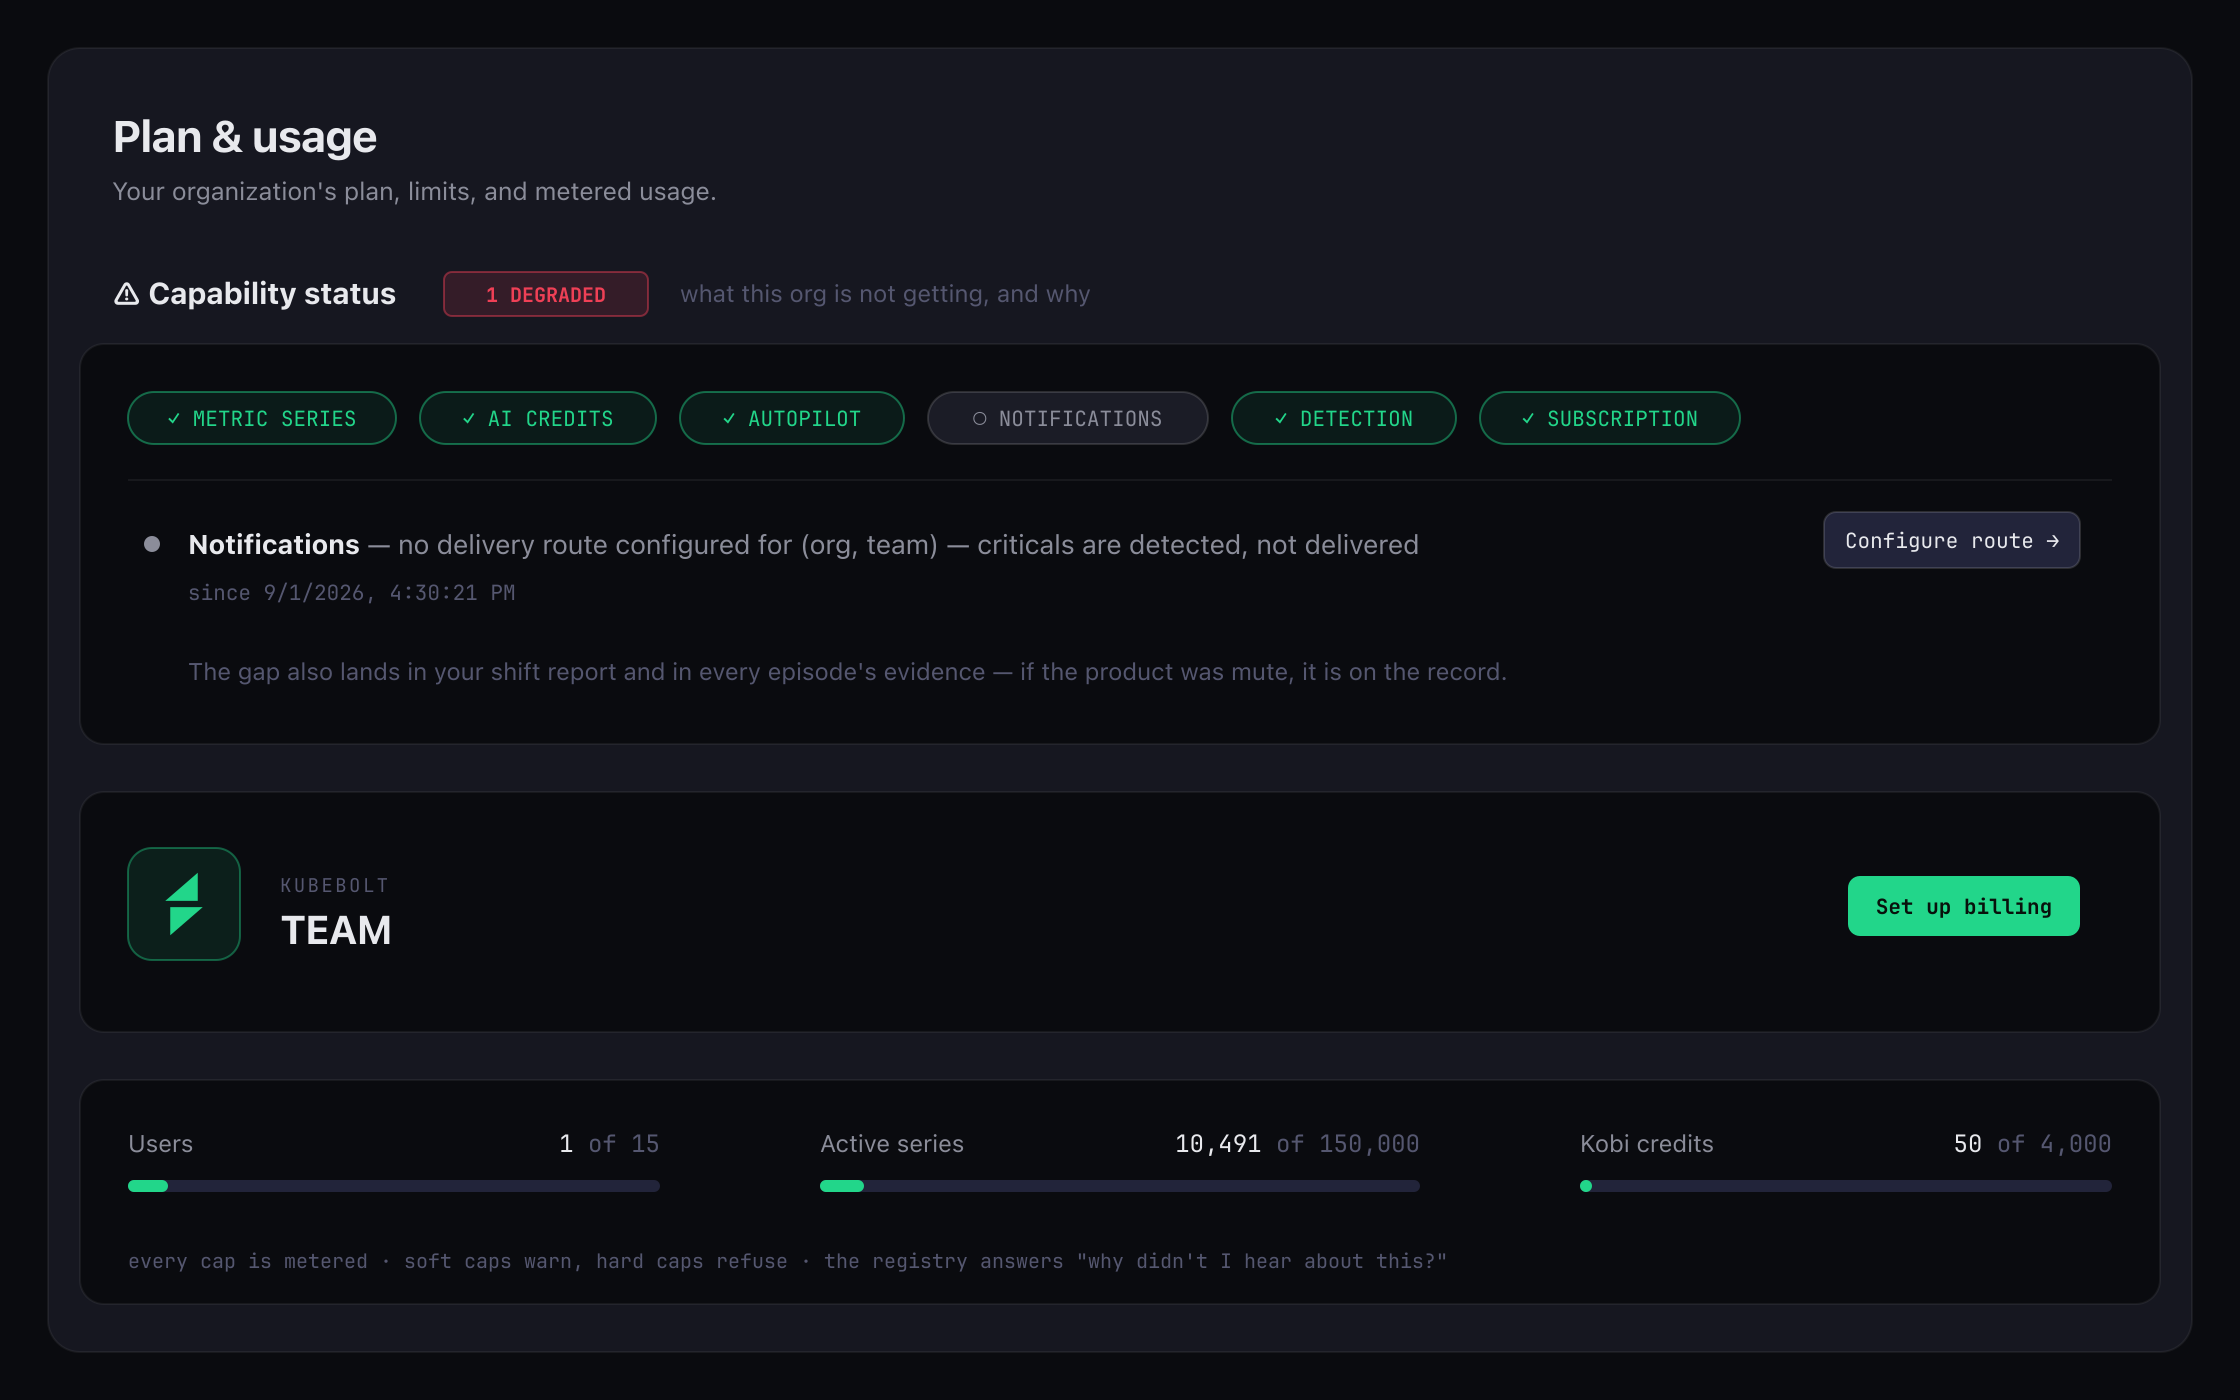
In 2.1 that answer lives inside the product. There’s a capability registry you can query per organisation, covering Autopilot, notifications, plan caps and the credit budget, each with its status and since when.
And it’s painted where it hurts. With no notification route, you see it immediately, phrased the way it actually is: criticals are detected, but not delivered. With the button to fix it beside it. Those gaps also travel into the shift report and into the episodes’ evidence, so if the product was mute for a stretch, the record says it was.
It’s the same discipline we apply to postmortems and to Autopilot’s action log: we prefer a system that admits its gaps to one that presents a smooth story.
What you’ll notice most under the hood
Of the seven versions, one improvement will probably pay for somebody’s month.
Agent 1.4.0 drops the veth interfaces created by cloud CNIs out of the box. On a real 2,183-pod AKS cluster that was around 85% of active series: from roughly 437,000 down to roughly 145,000. On the Team plan, whose included cap is 150,000 series, that’s the difference between one cluster eating the entire quota and three or four fitting inside it. If you run KubeBolt, upgrading the agent is the first thing we’d do.
The rest of the fine work went to Autopilot, Copilot and security:
- Autopilot tells external things apart by their address. A downed Azure Postgres database is named as an external dependency and escalated to a person, instead of proposing to recreate it inside the cluster, which was a meaningless action. And the diagnosis now names the cluster when you work across a fleet.
- “Suggest only” mode ends honestly. A correct diagnosis closes as a recommendation ready for review, not as a failure. There was an ugly bias there: the most conservative mode was the one that looked worst in the metrics. A backfill reclassified the history.
- Exported postmortems are signed, with fonts embedded, so they render identically offline. And Autopilot credits reconcile to the unit across every view.
- PVCs gained a monitoring tab, covering space and inodes with thresholds at 85 and 95%. A volume at 3% usage can be failing every write through inode exhaustion, and until now no view showed you that.
- Continuous security hygiene: image scanning runs before every tag, the waves of Go standard-library CVEs were closed on the spot, and third-party waivers carry an expiry date so nobody inherits an eternal exception.
We also shipped a new mark along the way. The Split Bolt now lives in the app, the site, the favicons and the letterhead of the postmortems you export. The brand sheet is public at kubebolt.io/brand.
What’s left
Memory opens doors we haven’t walked through yet. An episode with its recurrence counted is the raw material for a recommendation of the form “this has happened to you eight times, here is the fix, and it costs one pull request” — and that is where we want to take durable remediation.
For now, what exists is more modest and more useful: when you come in the morning, the product tells you what you missed, with timestamps, with history, and without pretending it saw everything.
If you run KubeBolt Cloud, your shift report is already waiting on the Home. If you don’t yet, start free: two clusters, no time limit.