You already have an agent open all day. What it does not have is any context about your production.
So you act as the bridge: you paste a YAML, describe from memory what you just saw on a dashboard, copy half a screen of kubectl describe, and ask it to reason about a cluster it cannot look at. It works some of the time, and it fails exactly when it matters, because all it gets is whatever you thought to copy.
From 2.2 it can look. You create an MCP only key, tick the clusters it may reach, paste it into your client, and your agent reads your fleet through the same twenty-nine read tools Kobi uses. It cannot touch anything: the role is pinned to viewer on the server, whatever the request asks for.
Five minutes: create the key and connect it
In Administration → API tokens, the create dialog has a new scope option.
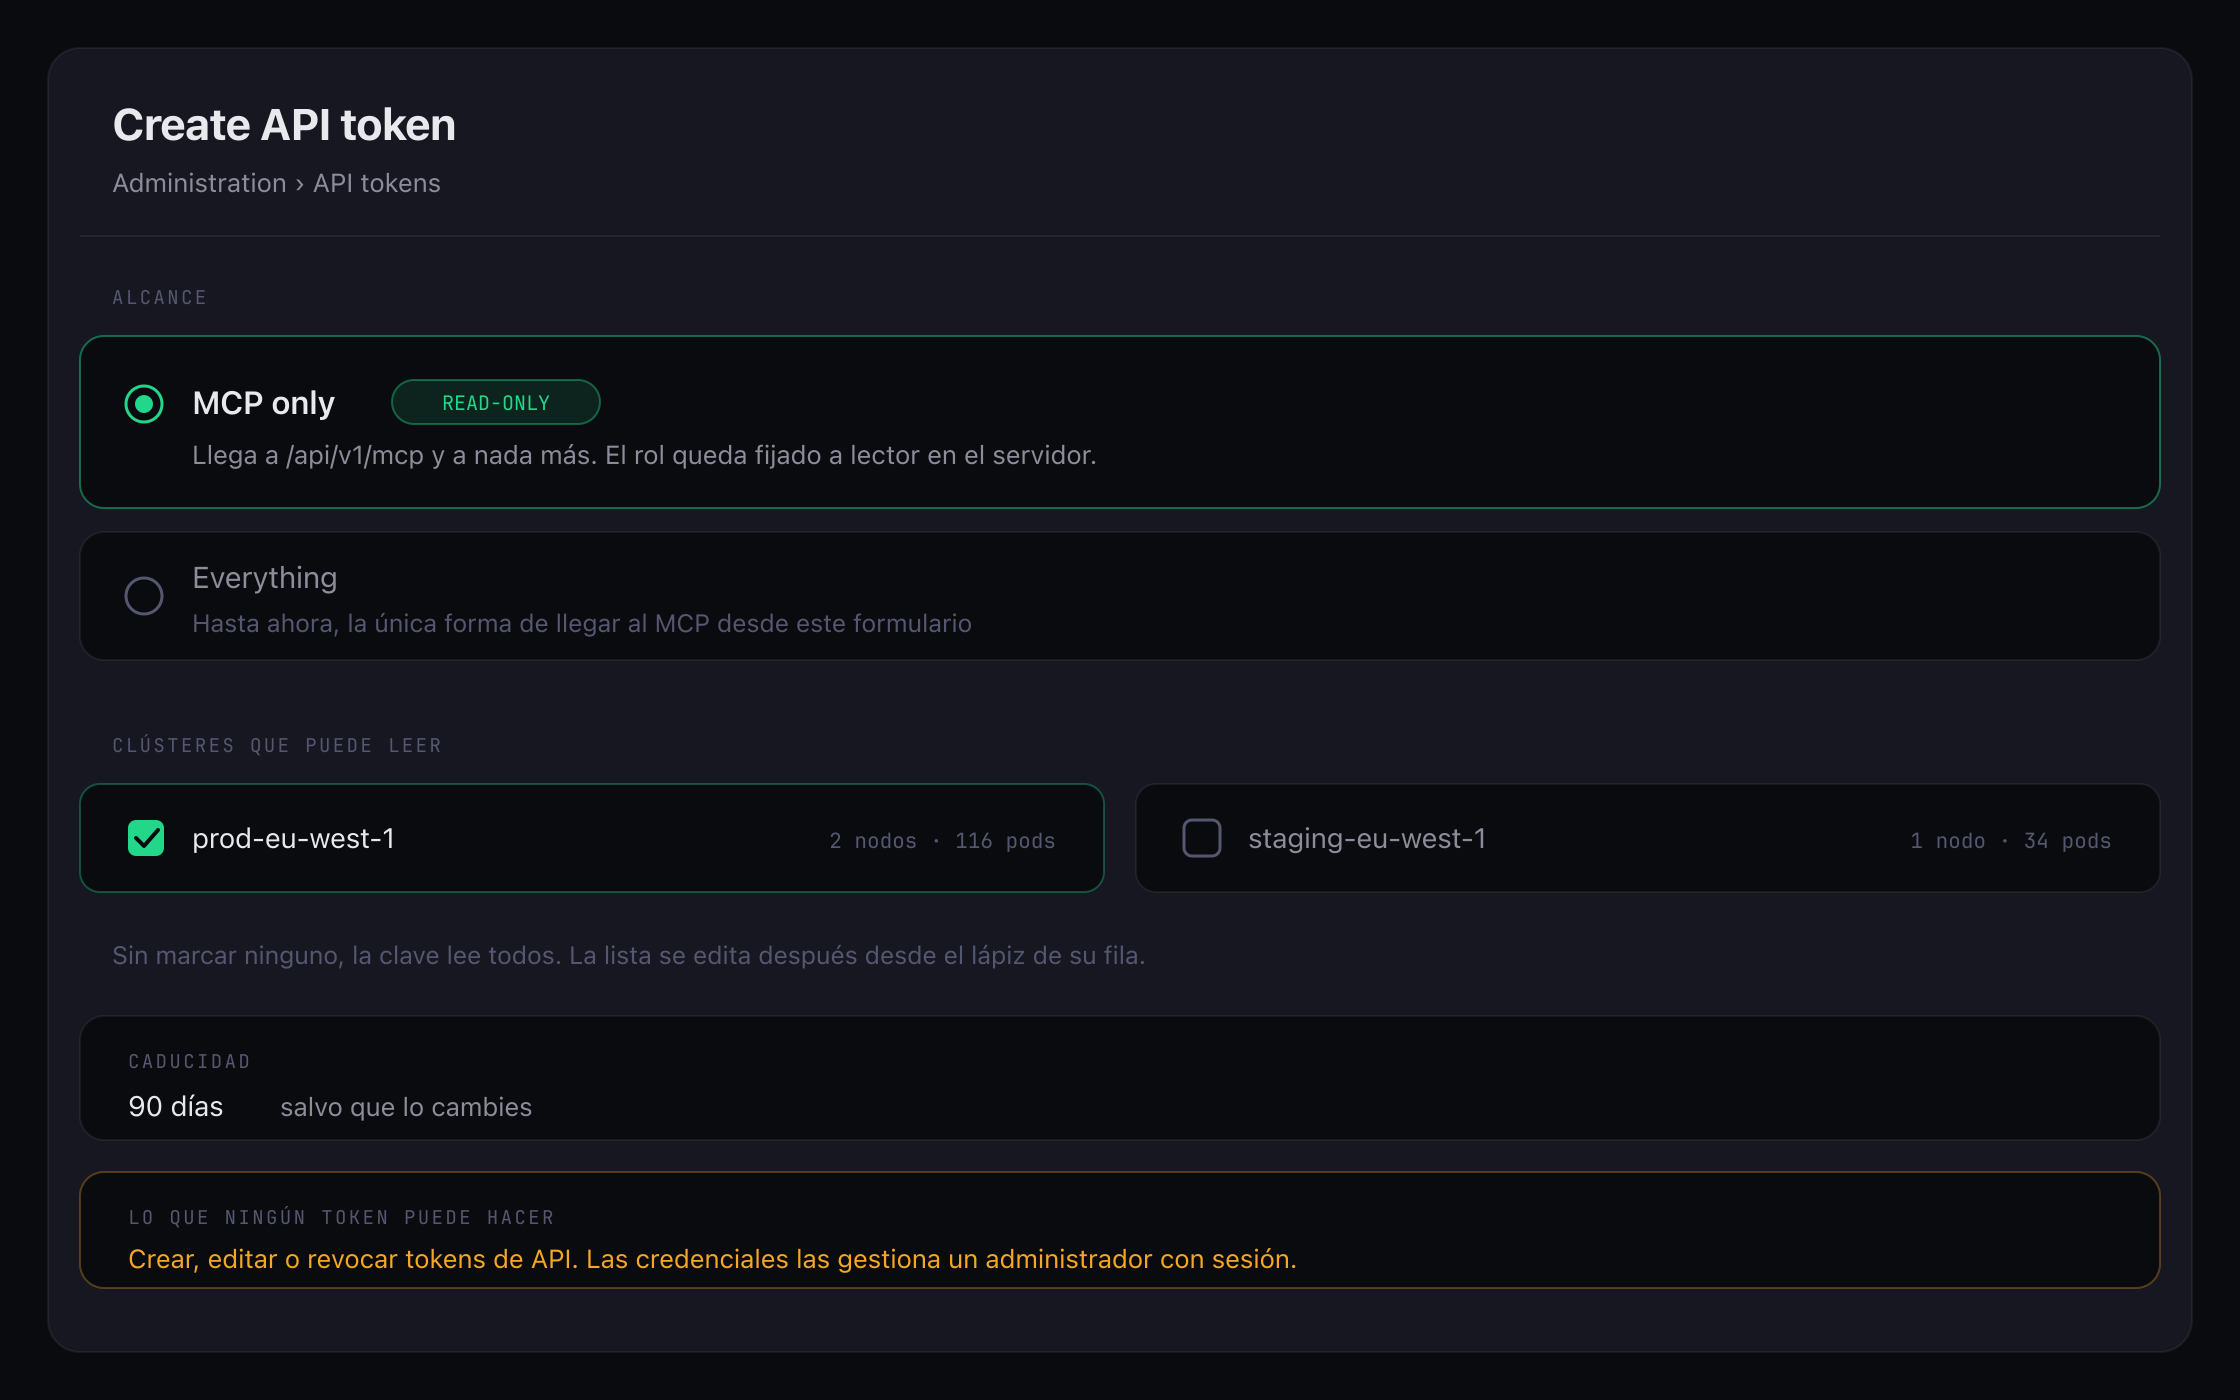
MCP only (read-only tools) does three things at once: the key reaches /api/v1/mcp and no other route, its role is pinned to viewer on the server (not in the form, on the server), and it expires in ninety days unless you change that. Below it you tick the clusters it may reach; tick none and it reaches every cluster in your organization.
Until now the only way to reach the MCP server from that form was Everything, which hands the whole API to a key that only needed to read. If you set a client up that way, it is worth replacing.
Then, in your client. The server speaks Streamable HTTP at POST /api/v1/mcp, so the configuration is the same as any remote MCP server:
{
  "mcpServers": {
    "kubebolt": {
      "type": "http",
      "url": "https://your-kubebolt/api/v1/mcp",
      "headers": { "Authorization": "Bearer kbk_…" }
    }
  }
}
In Claude Code it is one line:
claude mcp add --transport http kubebolt https://your-kubebolt/api/v1/mcp \
  --header "Authorization: Bearer kbk_…"
And if you work across clusters, add X-KubeBolt-Cluster: <context-name> to pin one. Without that header you get the active cluster, which stays pinned inside the token’s list so it cannot drift mid-conversation.
One detail takes a while to discover the hard way, so here it is as a table:
| Your client reaches KubeBolt through… | Token | Why |
|---|---|---|
| The UI URL (the nginx the chart or Compose bundles) | A kbk_ API key with MCP only | The nginx marks every request it proxies as public, and service tokens are refused there by design |
| The API directly, from inside your network | kbk_ or a kbs_ service token | A kbs_ token’s default scopes already include /api/v1/mcp |
That a leaked service token is useless from the internet is deliberate. If your agent runs on your laptop, the key you want is the kbk_ one.
There is also a third route with no server in between: the kubebolt-mcp binary speaks MCP over stdin and stdout against your kubeconfig, with no auth and no backend. For a local exploration it is the shortest path.
What your agent sees in there
Twenty-nine read tools, and thirteen are new in this release. That is the other half of 2.2: until now both Kobi and an external client read the cluster’s live objects and little else. The product already knew the rest and gave you no way to ask for it.
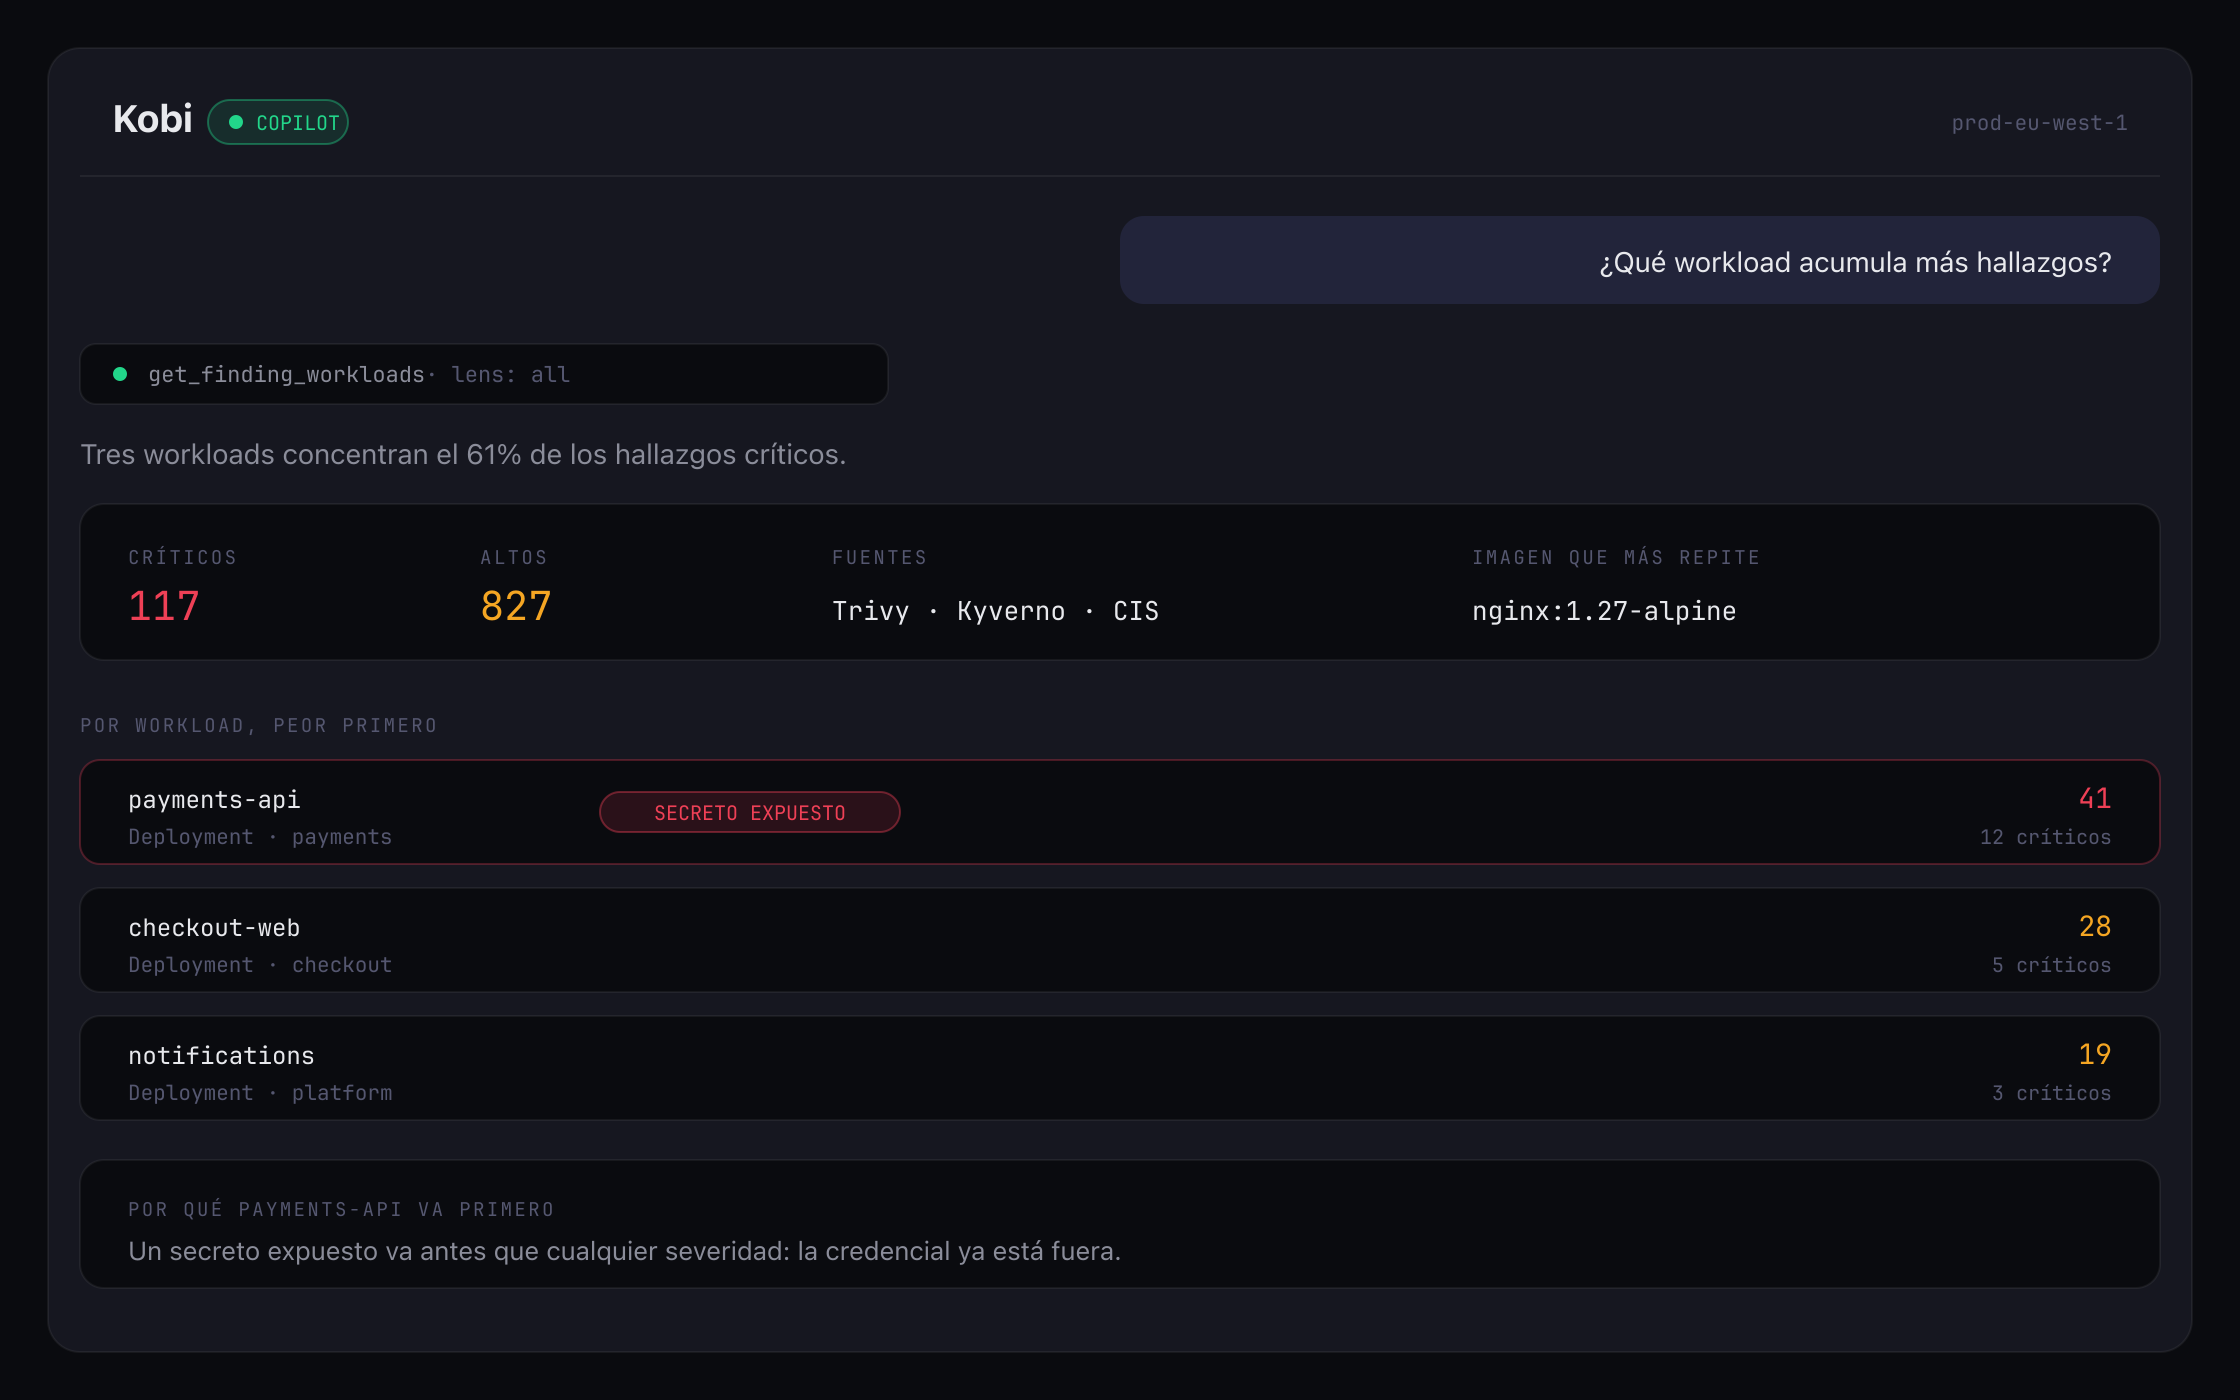
- Security: the cluster’s whole posture (Trivy, Kyverno, CIS), findings ranked by workload per the lens you are looking through, one finding re-read live from its scanner, and Falco’s runtime events. The image filter accepts the short form,
nginx:1.27-alpine, against the full reference the scanner stores: an exact match found nothing, and “nothing” reads as a clean image, which is exactly the question you ask before a rollback. - History: the insight episodes 2.1 introduced, and the bursts. An agent asking about a dead pod can now ask first whether half a dozen things went down with it.
- What changed just before: the last hours’ rollouts, with image and age. And it states what it cannot see, so an empty list never reads as “nothing changed”.
- Metrics and capacity: PromQL instant or over a range, the right-sizing behind the Capacity page, the node filesystem, and coverage.
That last one deserves its own line. get_coverage reports what KubeBolt can and cannot see on that cluster: which metric sources are active, which agents are connected and how, and where the gaps are. It exists so that “I see no data” is never mistaken for “there is nothing”, which is the difference between a careful agent and one that hands you a conclusion with the same confidence whether it has data or not.
All of them answer from where the data is stored rather than from the cluster, so a cluster that is down still has a history. And while the live connection is momentarily gone, initialize and tools/list keep answering: your client’s session does not collapse, it just tells you that this particular call needs the cluster online.
What it cannot do, and why that is the relief
The convincing half of all this is not the reach, it is the limit. A key that only reads is the only kind you can paste without a second thought into a client whose decision loop you do not fully control.
The nine tools that propose changes — scaling, restarting, patching resources or probes — are neither listed in the catalogue nor callable by name. This is not a permission check that could fail open: on that surface they simply do not exist.
An agent that cannot write does not need you to trust its judgement, only its reading.
On top of that there are four more things, all checked on the server:
- The token’s cluster list is consulted before any other shortcut and on every read path, including the ones that name no cluster and the listings themselves:
GET /api/v1/clustersandlist_clustersname only what that key may read. - No token can touch tokens.
/api/v1/admin/api-tokensis closed to every key, whatever its scopes say. Credentials are managed by a signed-in admin, so a leaked key cannot mint itself a broader one. - Caller-written PromQL stays inside its cluster, and the metrics store itself now does the confining, on the parsed query. Before, a text rewriter did it, and three shapes slipped through: bare metric names like
up, selectors with a decoy label containing the reserved name, and MetricsQL or-filters, where the pin bound only the first branch. On a shared VictoriaMetrics, those three read other clusters’ series. - Results are redacted. Secrets appearing in logs, environment variables, command lines,
describeoutput and events are masked before they reach the model, with the same detectors whether the caller is the chat or your client. Pure hex runs, such as a trace ID, are left alone.
The same catalogue feeds Kobi and Autopilot
What makes this more than one more integration is where it comes from. There is no catalogue for the chat, another for MCP and another for Autopilot: there is one, and each consumer gets a profile over it.
Autopilot’s agents used to have ten read tools of their own, thin wrappers over endpoints the executor already served. They are gone. Each agent now reads from KubeBolt’s MCP with its own profile, behind a gate that admits only service tokens: a signed-in browser user is refused whatever their role, and an API key is refused by type. A profile that names a tool which does not exist fails to boot, rather than quietly serving less.
The practical consequence is that a read written for Kobi reaches Autopilot the same day. You can see it in what the agents gained:
- The investigator gains bursts, insight history and workload metrics. A node burst explains its victim, a recurrence says the last restart only postponed the problem, and measured usage decides between an OOM and throttling instead of guessing.
- The planner sizes a resources patch from real usage, does not repeat a restart that already failed, and says whether a rollback lands on an image with a critical CVE. It says so; it does not block.
- Actions stay where they were, on Autopilot’s own server, next to the approvals, the blocked namespaces and the destructive gate. Never on the public
/mcp. And since only the agent that acts mounts it, the other four have stopped paying some 34,000 tokens per incident for schemas they were denied.
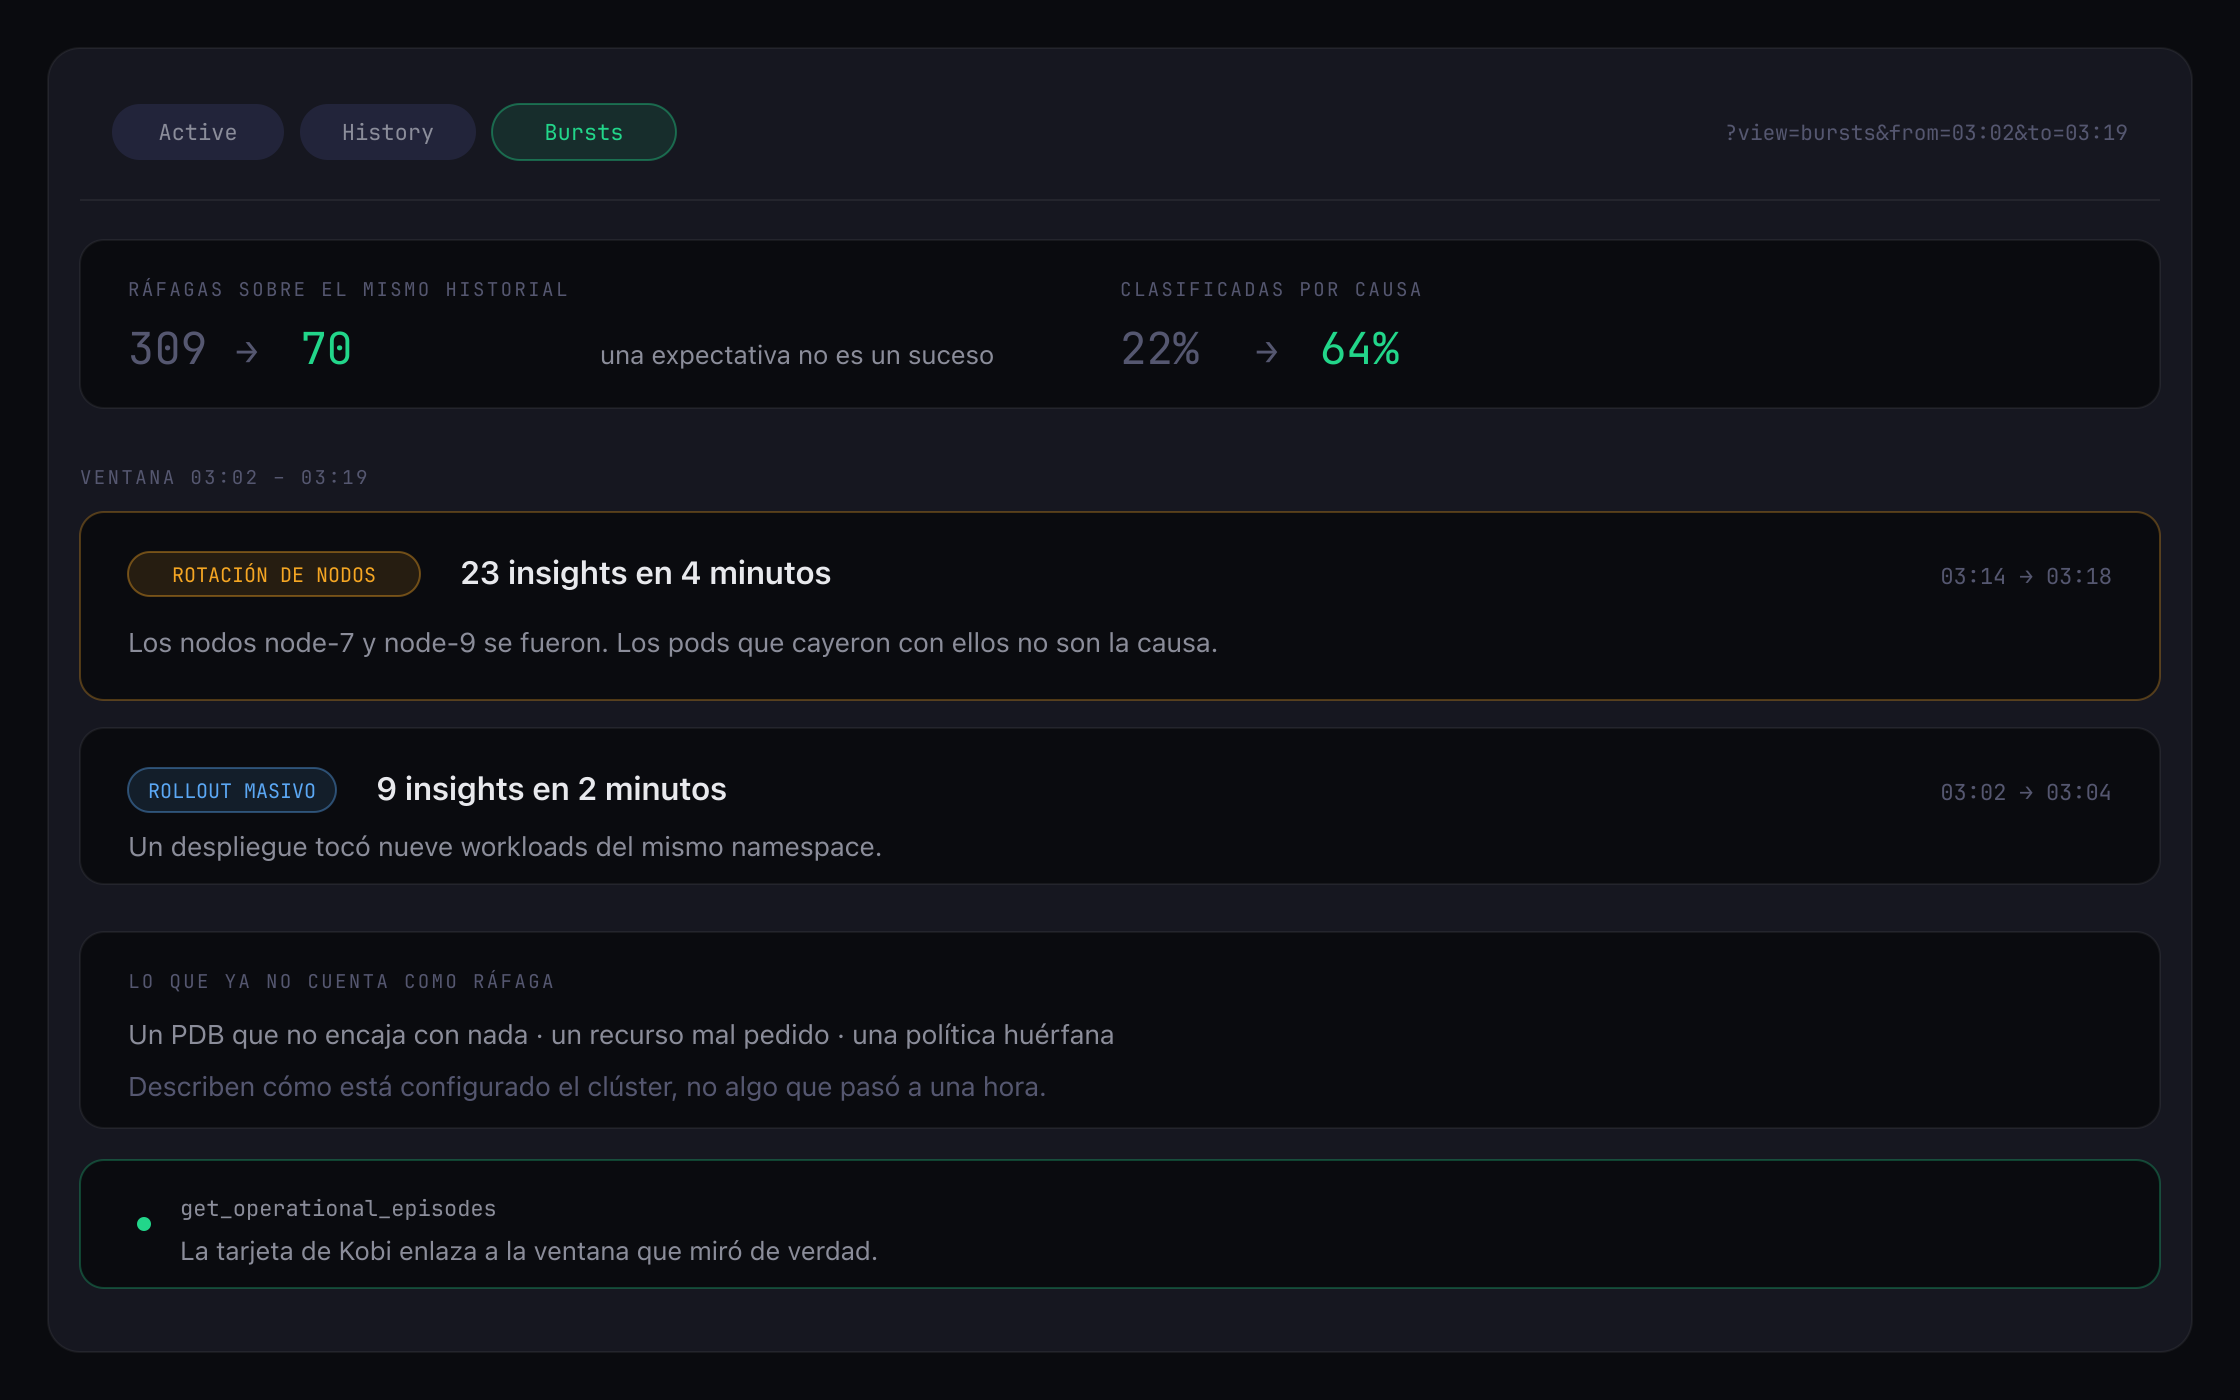
The bursts in that figure improved on their own account too. Only malfunctions form a burst: an expectation, such as an orphaned policy or a PDB that matches nothing, describes how the cluster is configured rather than something that happened at an hour, and the evaluation tick stamped them all with the same timestamp. Replayed over a real history, 309 bursts down to 70, and the share classified by kind from 22% to 64%. They now have their own segment at /insights?view=bursts, with the window in the URL, so a burst can be linked and the card Kobi draws points at exactly what it looked at.
What it took to make the answers fit
Handing an agent more tools is worth nothing if the answers get cut. And they were getting cut.
list_resources and get_cluster_overview returned what the screen draws. Fourteen kube-system pods came to 41 KB between annotations, volumes, environment, every container’s full spec and every condition. A tool response is capped at 32 KB. The answer was cut in half and nobody noticed, because truncation is not an error: the model received something of the right shape and counted eighteen pods where there were fourteen.
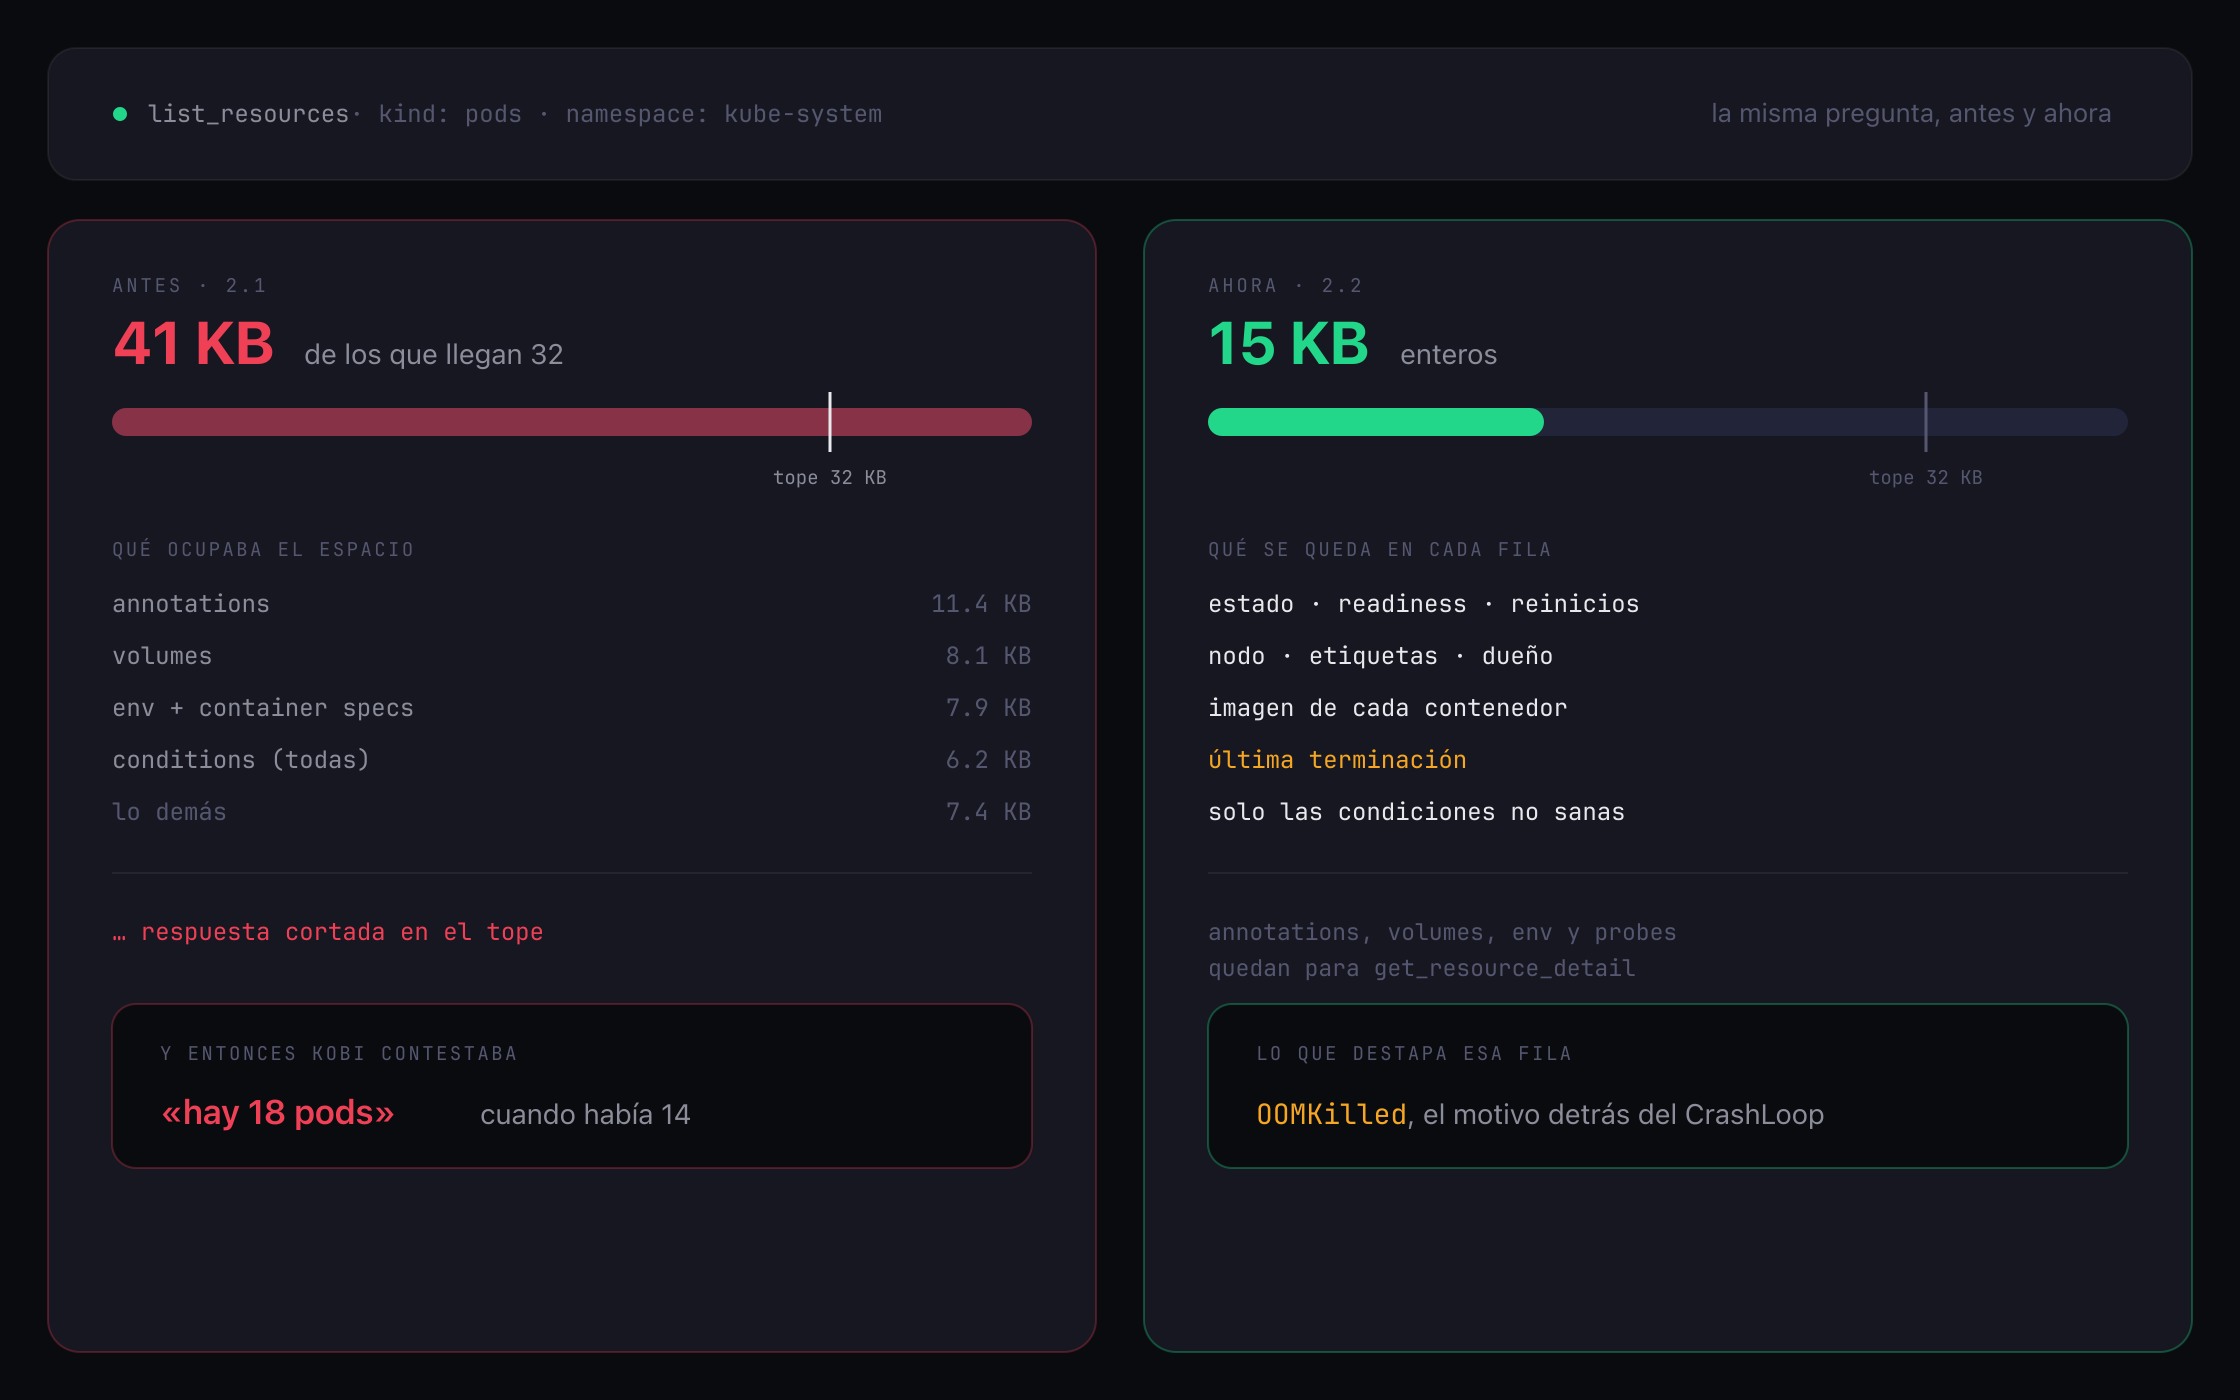
Each row now keeps what a diagnosis actually uses: status, readiness, restarts, node, labels, the owner as Kind/name, each container’s image, its resources and last termination, the OOMKilled behind a CrashLoop. Of the conditions, only the unhealthy ones travel. The rest is left to get_resource_detail, and the response says so, which is the part that matters: the agent knows there is more and knows where to ask for it. 41 KB to 15, and the cluster overview from 38 to 10.
The REST API and the UI are unchanged. This is what the models read.
Two small fixes in the same spirit take a lot of friction out of an external client. Resource types are accepted the way Kubernetes names them, singular or plural, any case: only the plural key used to get through, models write pod and Pod, and most describe calls failed on exactly that. And a list_resources on a CRD that is not installed answers “not installed” instead of “forbidden”, which used to send people chasing an RBAC grant for an API that did not exist.
Where to start
If you already run KubeBolt: upgrade to 2.2.0 and the agent to 1.4.1, a security patch on the same metric schema that drops in without touching anything else. Then create an MCP only key, tick a test cluster for it, and paste it into the client you already have open.
If you do not yet, start free: two clusters, no time limit, and the MCP server included from day one.
The first question worth asking is one that had no answer before. What was deployed in the last hour, or which workload carries the most findings.