Cost & Rightsizing (Beta)
Per-cluster cloud spend powered by OpenCost — run-rate, idle cost, and money-priced rightsizing recommendations.
When OpenCost data flows from a cluster, a Cost sub-tab (marked Beta) appears on its dashboard, and the spend figures on Home and Fleet start counting it. There is no new backend service to operate: the tab is a lens over cost metric families the agent ships into KubeBolt’s metrics store, scoped per cluster like everything else.
What the Cost tab shows
- Card row — four cards: the monthly run-rate (with the hourly rate and the cost per pod in its sentence), idle cost (what you pay for capacity nothing uses), the savings the rightsizing recommendations recover, and efficiency (how much of the CPU you requested is in use). Idle cost lights amber when 60 % or more of the spend is idle.
- Trends — spend run-rate and allocated-vs-total cost over the selected range.
- Breakdown — cost by namespace, workload, and node, so “who is spending this?” is two clicks away.
- Rightsizing recommendations, in money — the same recommendations the Capacity tab computes from real usage, priced per item.
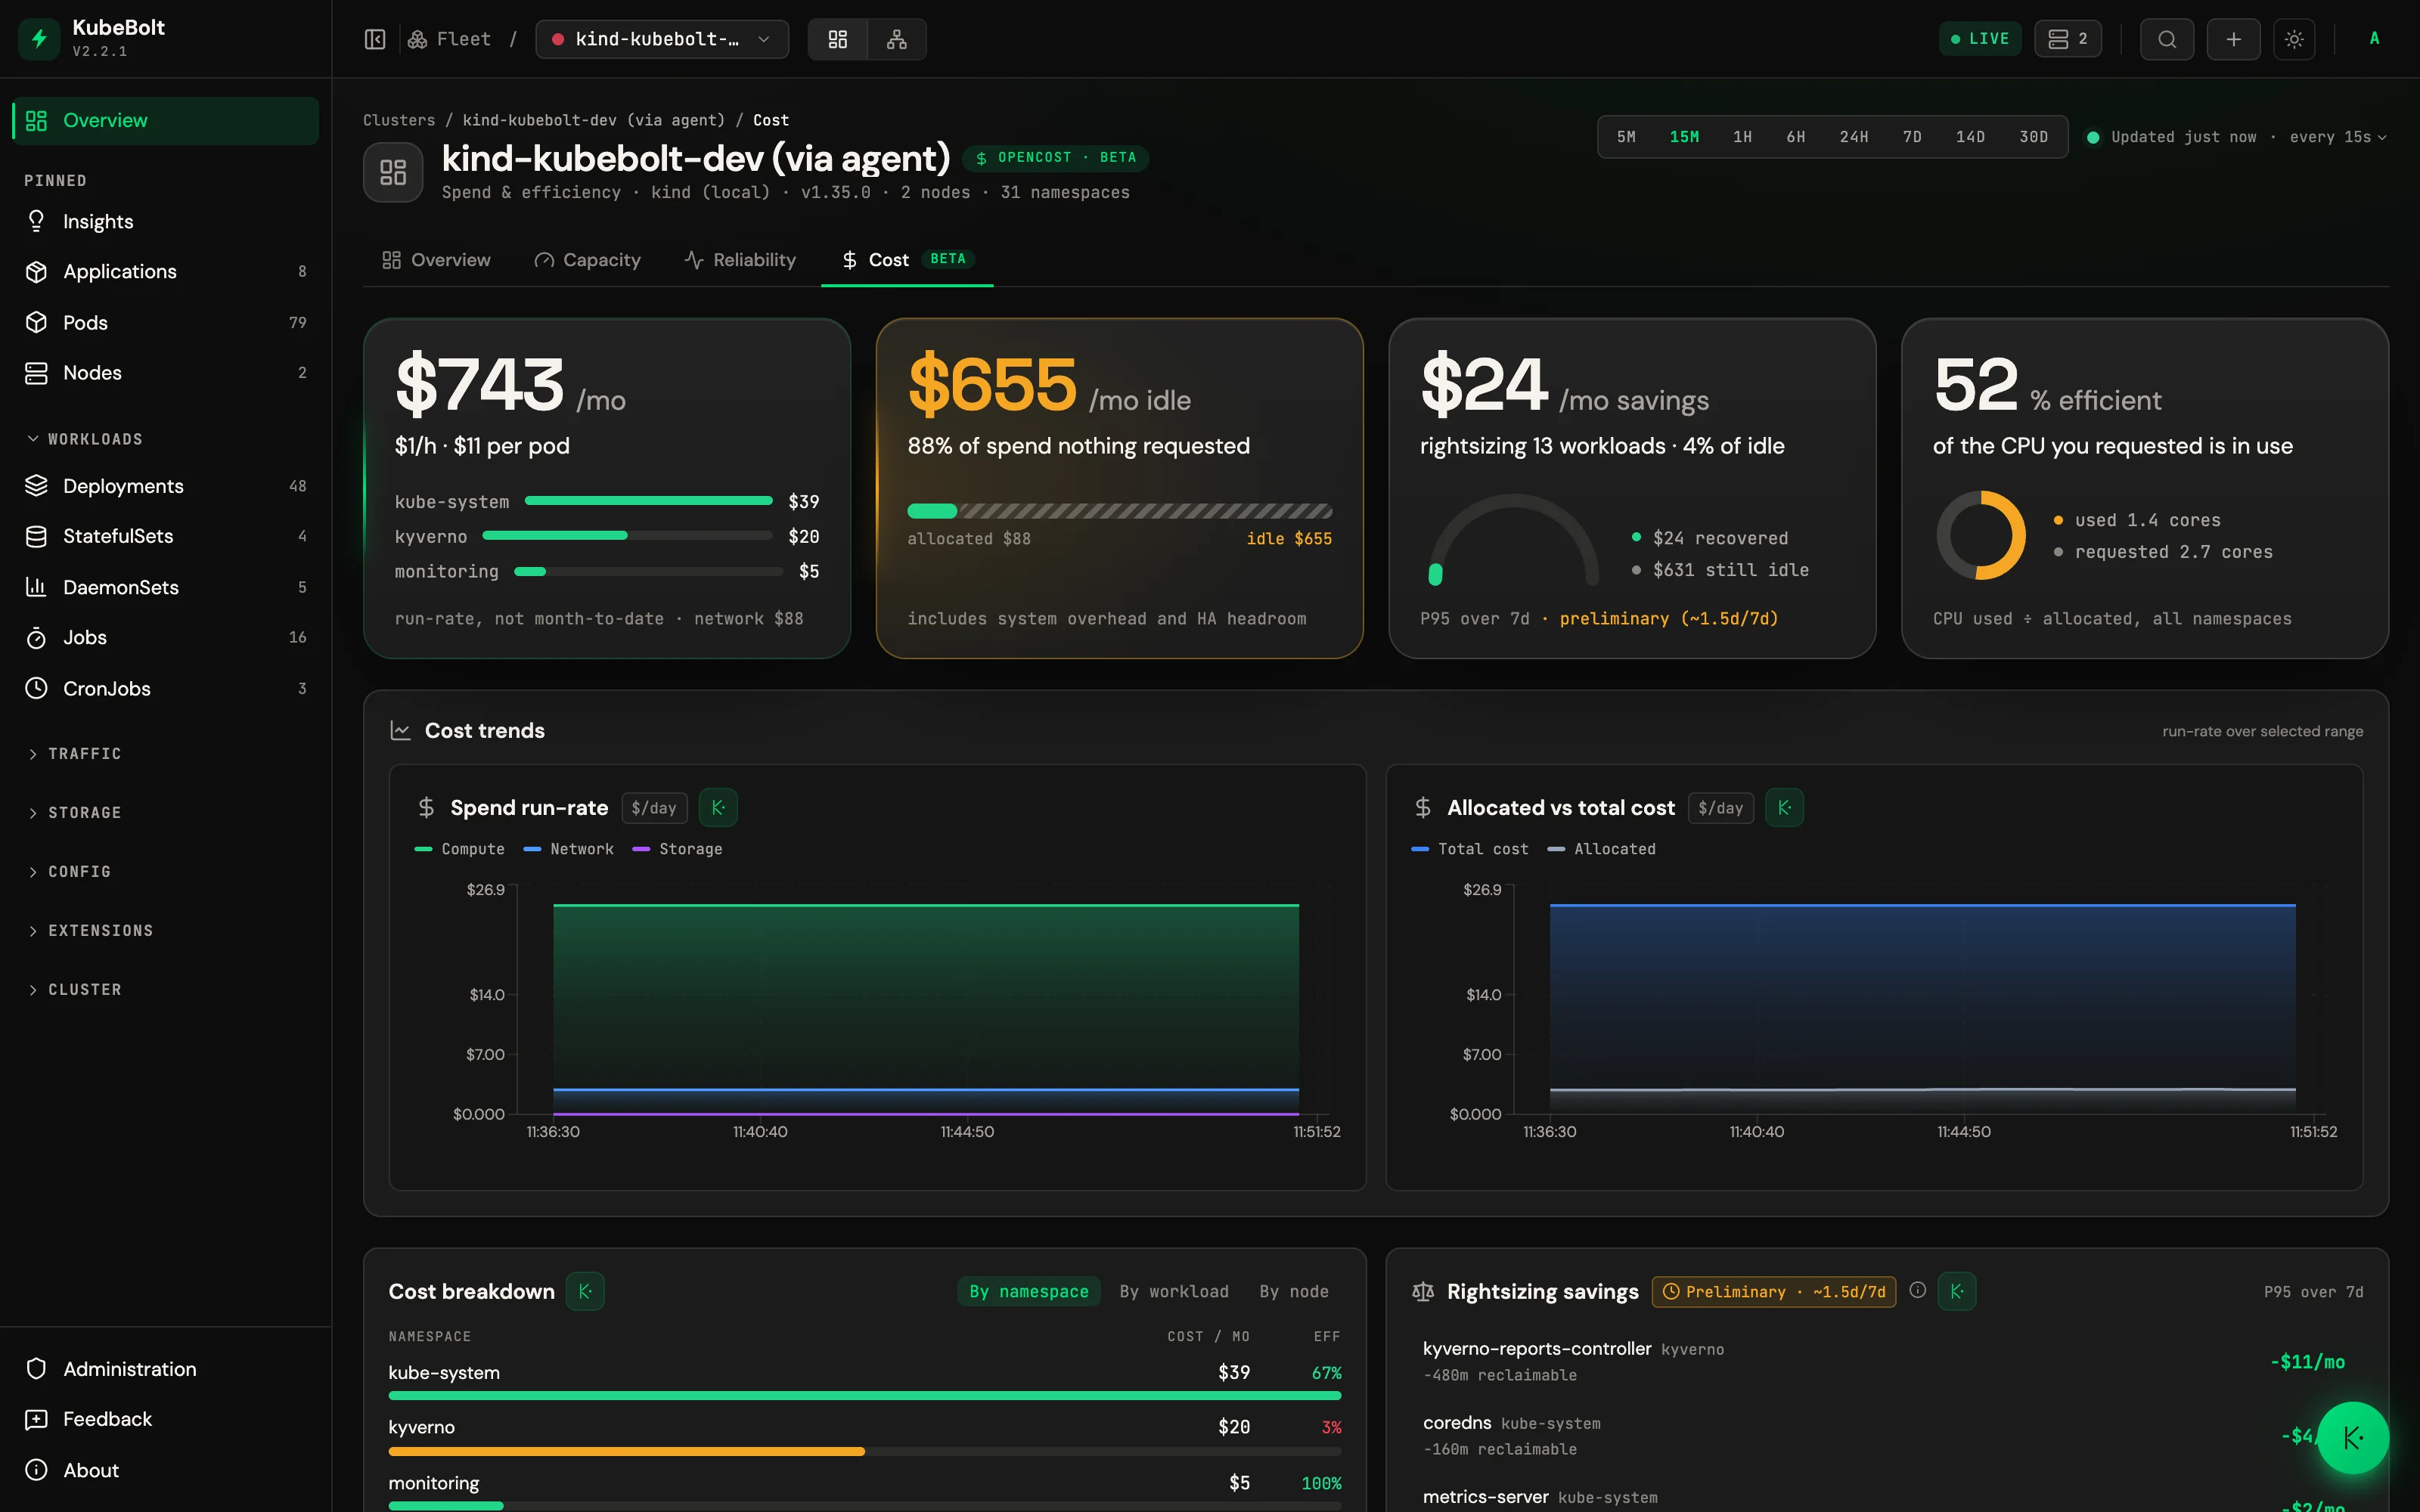
When the underlying data window is younger than 2 days, rightsizing panels carry a Preliminary badge — treat those figures as directional, not a mandate.
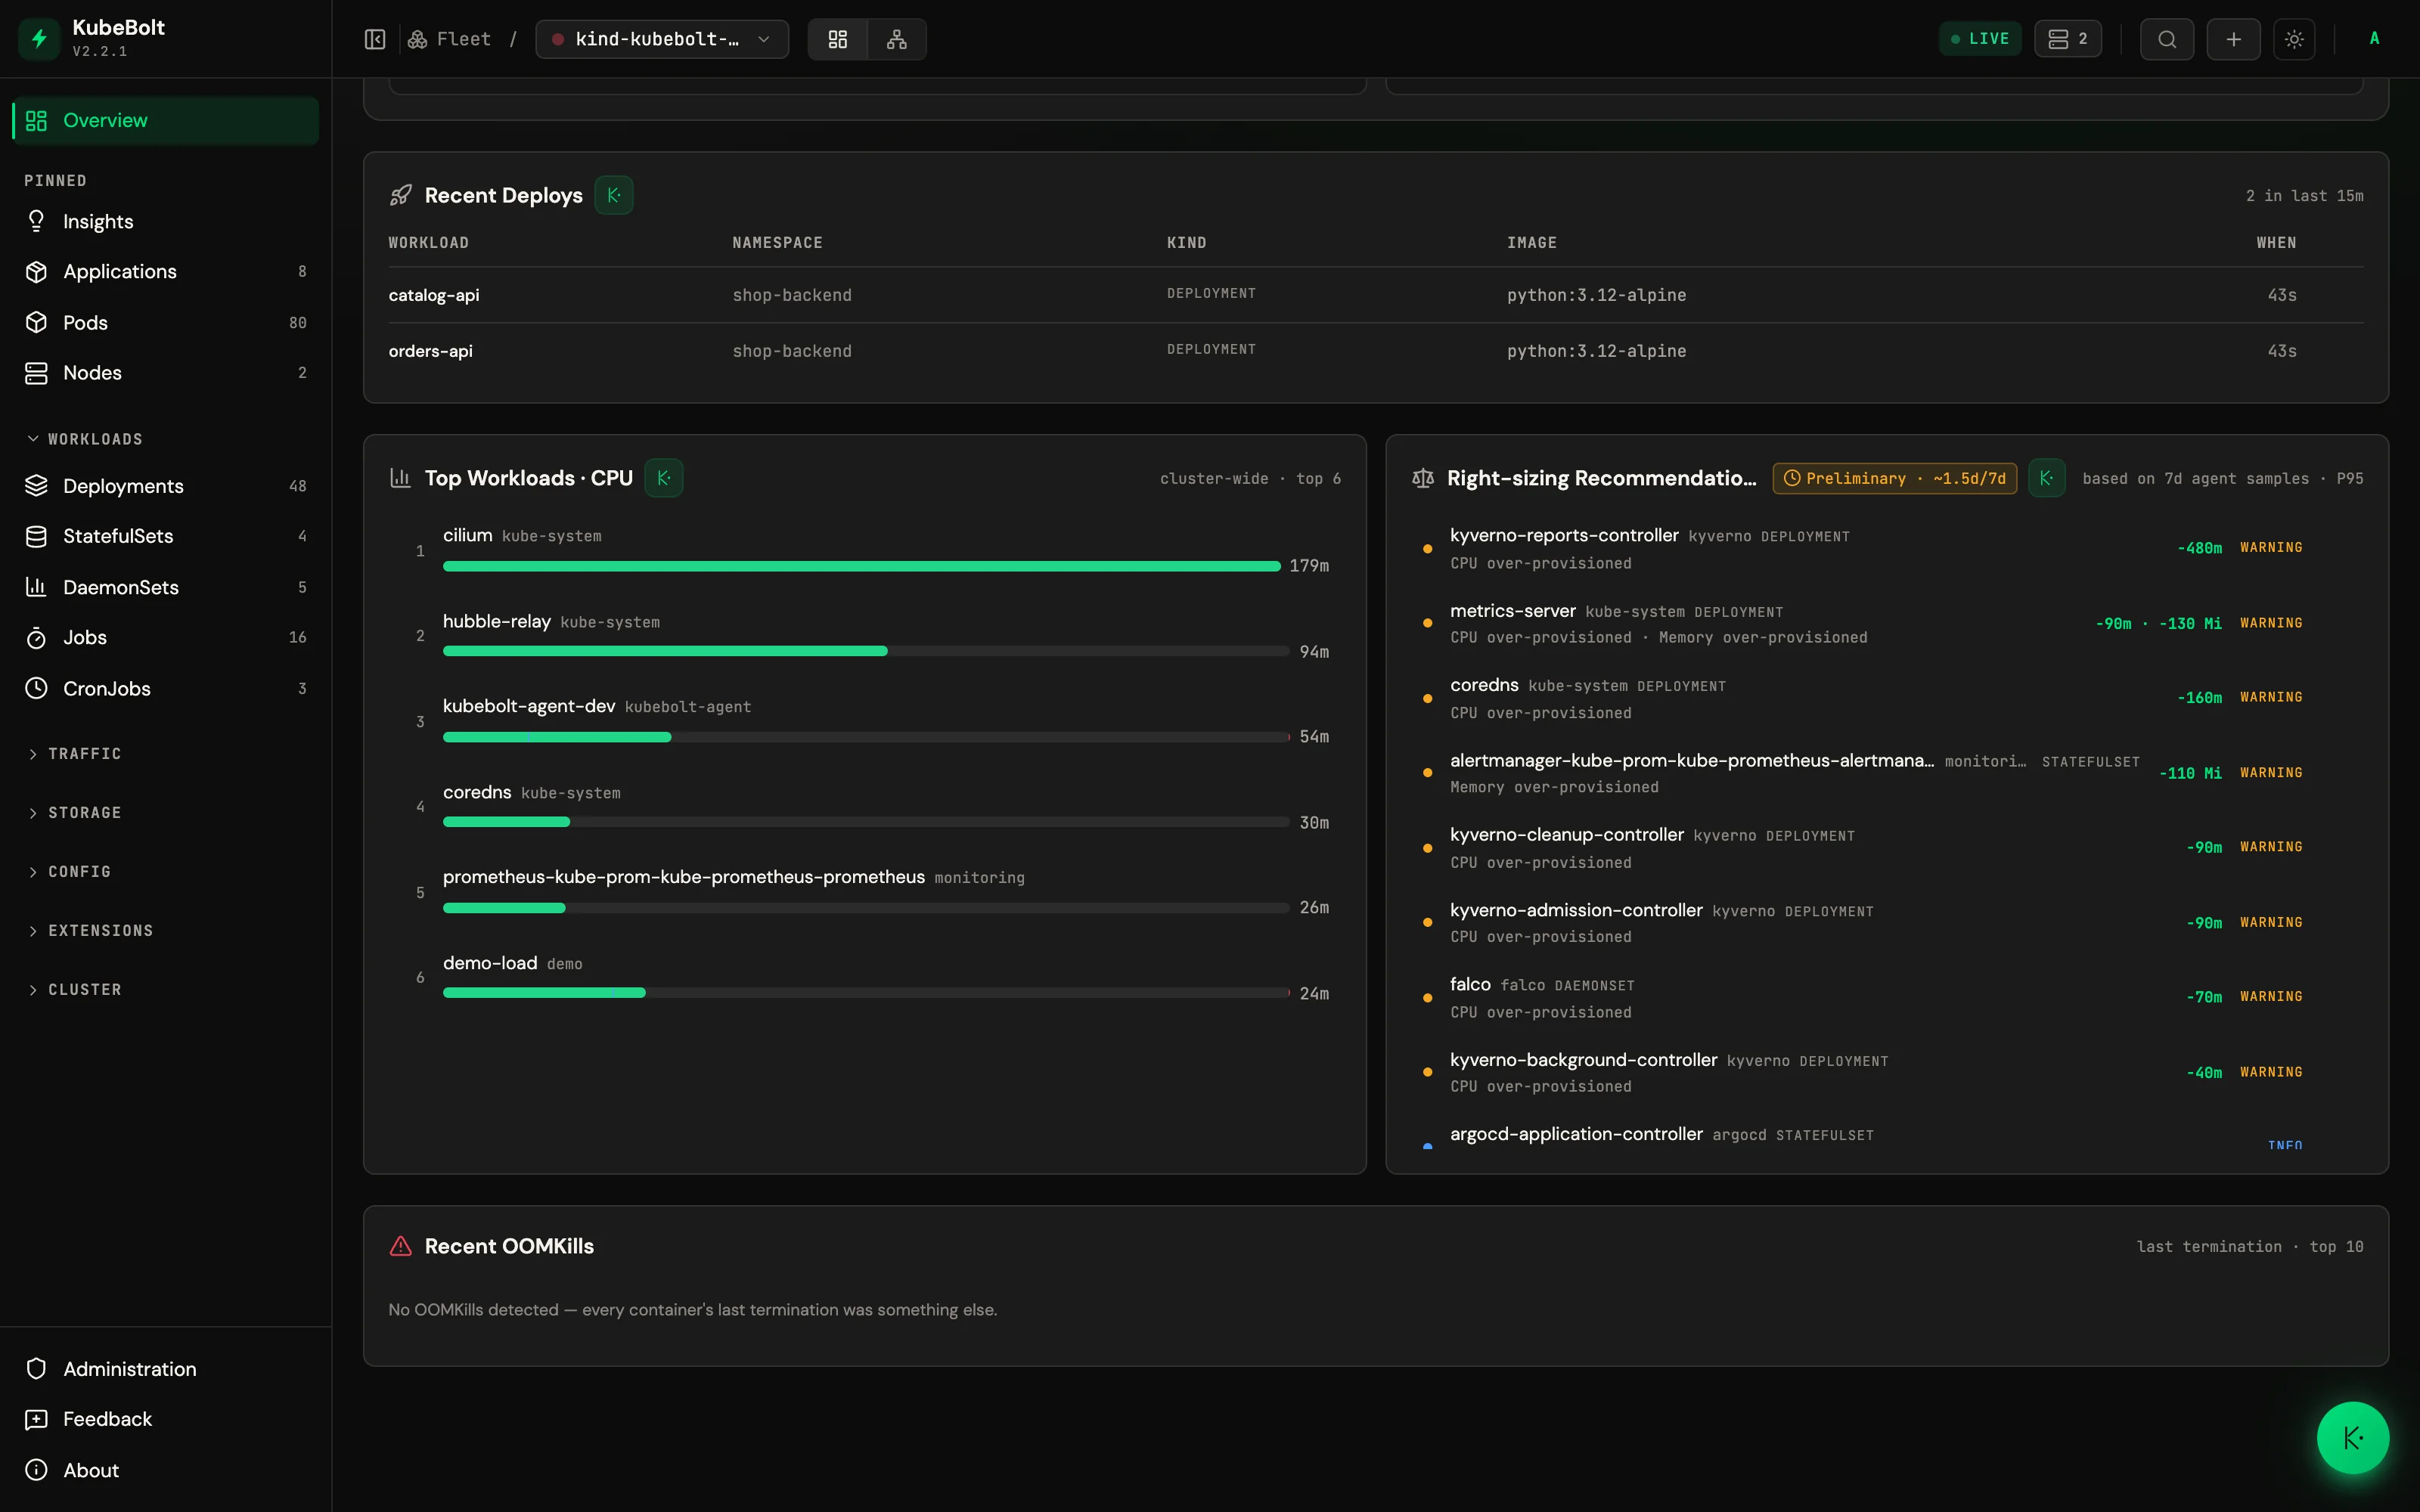
Kobi reads the same engine through get_right_sizing, so asking it in the chat
and reading the Capacity or Cost screen give the same numbers. The
recommendations are not recomputed for the conversation.
Requirements
- Agent 1.3.0 or newer (OpenCost sourcing shipped in that line).
- OpenCost metrics reaching KubeBolt via one of the three modes below.
Three ways to connect OpenCost
Pick one in the Add cluster wizard — it renders the final helm values:
1. Bundled by KubeBolt — the agent chart installs OpenCost as a sub-chart and scrapes it. Simplest path if you don’t run OpenCost today. OpenCost itself reads usage from a Prometheus, so point the sub-chart at yours — the wizard asks for the URL and fills these in:
--set opencost.enabled=true \
--set opencost.opencost.prometheus.internal.serviceName=<prometheus-service> \
--set opencost.opencost.prometheus.internal.namespaceName=<prometheus-namespace>
Without a reachable Prometheus the sub-chart defaults to
prometheus-server.prometheus-system and OpenCost fails to start where that
Service doesn’t exist.
2. Scrape your existing OpenCost — you already run OpenCost; the agent scrapes its exporter. List it under the agent’s exporters:
--set collectors.exporters.opencost=http://opencost.opencost.svc.cluster.local:9003/metrics3. Read from your Prometheus — your existing Prometheus already scrapes
OpenCost; the agent reads the cost metric families through the same
promRead connection used for metrics:
--set agent.promRead.enabled=true \
--set agent.promRead.cost.enabled=true \
--set agent.promRead.url=http://prometheus.monitoring:9090
The cost families involved are node_*_hourly_cost,
container_*_allocation, and pv_hourly_cost — appended to the core
KubeBolt metrics, never replacing them.