Home and Fleet
The global screens — Home's shift report and Fleet's roll-up — plus cross-cluster search and where the Add cluster wizard actually lives.
KubeBolt has two altitudes. Home, Fleet and Security sit above any single cluster and answer “what is going on across everything I own”; they read stored state and keep working when a cluster is down. The dashboard and the resource views sit inside one cluster. The sidebar changes with the altitude: global pages show Home · Fleet · Security · Administration, cluster pages show the cluster’s own menu. This page covers Home and Fleet; Security has its own page.
After sign-in you land on Home.
Where the Add cluster wizard is
Fleet → Connect cluster, or Clusters → Add cluster. Same button, same two paths, same modals — literally the same component. Home’s Connect cluster in the greeting header takes you to Fleet.
The button is a dropdown with two options, and the choice is not a matter of taste — it is whether this backend can reach your API server:
- Import kubeconfig — KubeBolt dials the API server directly. Use it when the cluster is reachable from where KubeBolt runs.
- Install agent — an agent in the cluster dials out to KubeBolt over gRPC. Use it when the API server is not reachable (private network, NAT, or a hosted backend such as KubeBolt Cloud).
The button only renders for users who may manage clusters. The wizard’s output is covered in Connecting clusters.
Home — the shift report
Home opens with a greeting card: the date, a greeting that follows your own clock, the cluster count, and a chip saying how many things need you (or All clear). Its lower half is “while you were away”: what actually happened since Home last rendered for you, not what is standing right now.
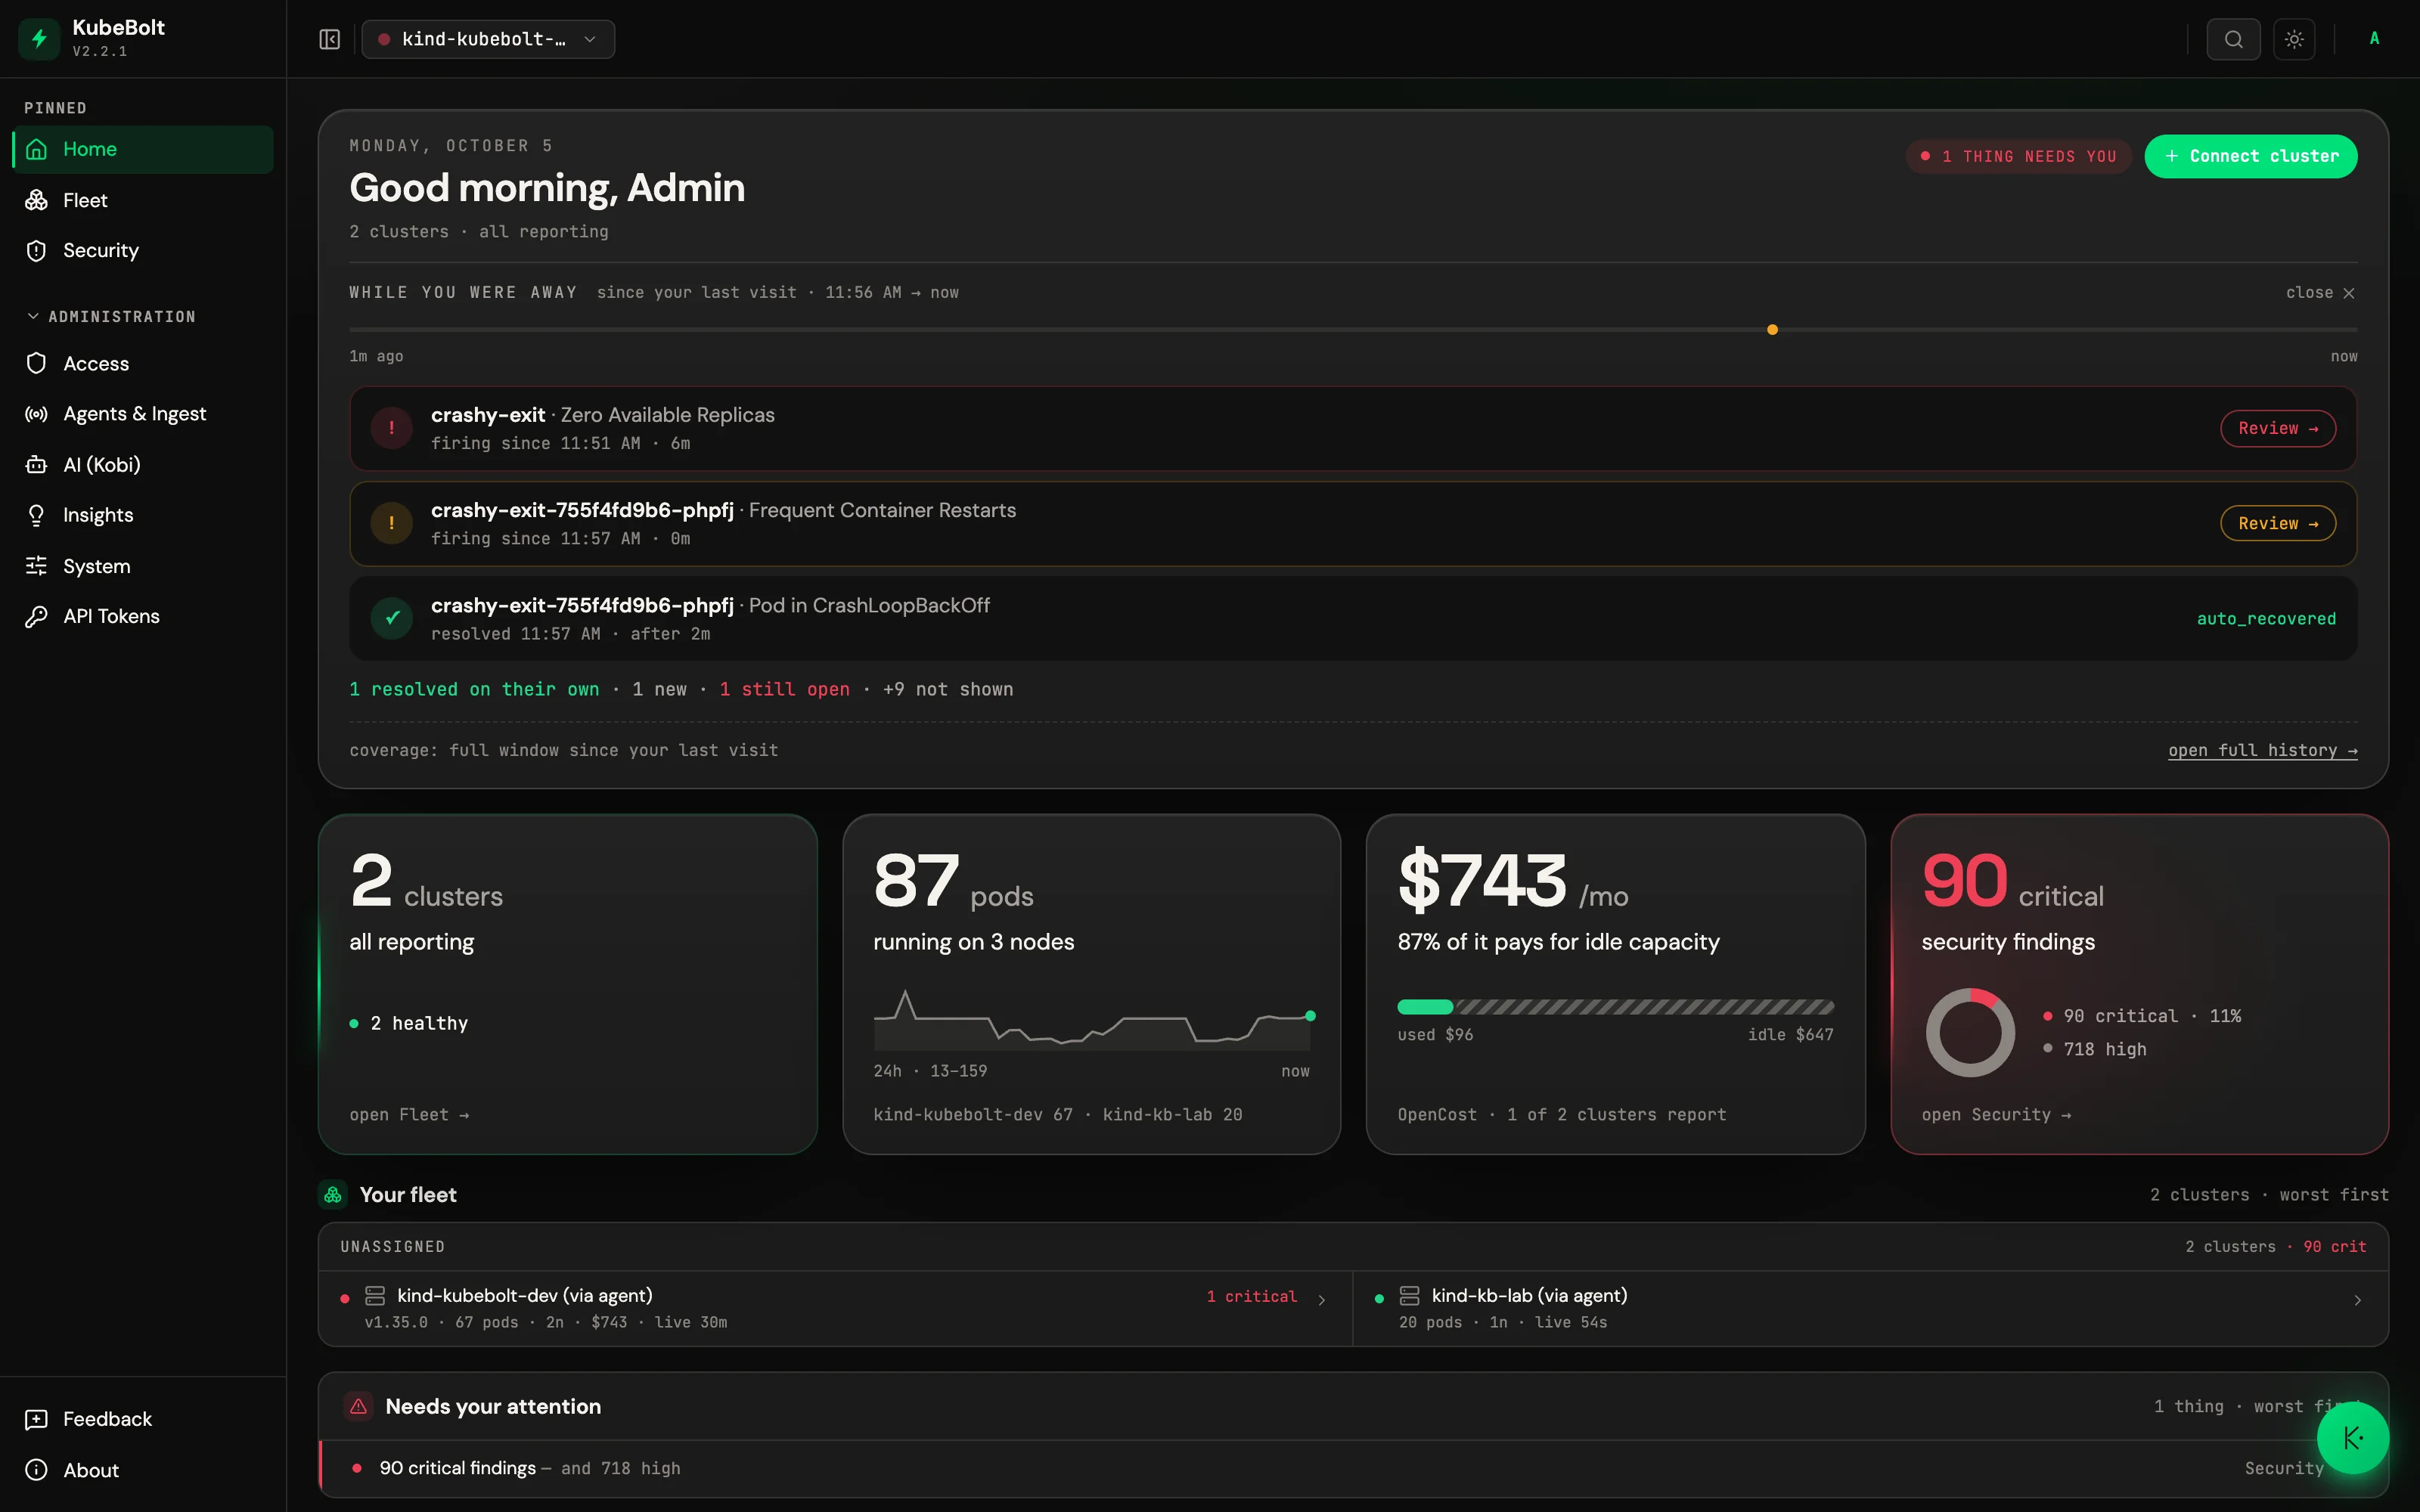
The window is drawn as a timeline, one dot per moment something opened. Episodes that opened together — a node rotation opens a dozen — share a dot, which grows with the count and takes the worst state among them. Under it go at most three episode rows, picked as a sample of the window rather than its top three: the worst thing still open (with Review →), the worst thing that resolved, and the most severe of what is left. A counted line covers the rest — resolved on their own · new · still open · +N not shown — and open full history lists every episode. A coverage line says which window was read: the full window since your last visit, the last 24 hours on a first visit, or the last 30 days when older activity has aged out of retention.
Alongside, the report clusters events into operational bursts deterministically — the same window in always produces the same bursts out — and names the shape it found: a node rotation, node pressure, a mass rollout, or an honest “unknown burst”. Each burst reads as a sentence, with the times, the clusters involved, the blast radius, and whether everything recovered. Past three bursts it summarizes instead — 47 bursts since Sep 5 — 45 recovered on their own, 2 with workloads still down — and over a window longer than a day its times carry the date.
Because it reports events and not state, it goes quiet when nothing happened. A shift where nothing broke says so. Dismissing it collapses the section to a ⟳ while you were away chip in the greeting’s chip row, which reopens it.
Below the greeting card is a row of four cards, built like the dashboard’s — a figure, a sentence, a small chart:
- Clusters — which ones need you and why (unreachable, no agent), and how many are healthy.
- Pods — the pods across your clusters, with their count over the last 24 hours.
- Spend — the monthly run-rate from OpenCost and how much of it pays for idle capacity, drawn as used against idle. Without OpenCost on any cluster, the card says how to get cost visibility instead of showing a zero.
- Critical findings — open critical security findings, as a share of critical plus high.
A card lights up only when its number asks for someone: an unreachable cluster or an open critical finding in red, a cluster with no agent in amber. Inventory numbers stay neutral on purpose.
Then comes a per-cluster breakdown when there is more than one cluster, an attention list (unreachable clusters, clusters with no agent or a silent one, critical findings), a Kobi panel with your recent conversations and an ask box, and Cost and Security panels.
Fleet — the roll-up
/fleet is every cluster KubeBolt knows about on one screen — health,
findings, nodes, pods and spend, without connecting to any of them — in a grid or
table view (your choice is remembered), sorted worst first. The header counts them
and says how many are reporting metrics, how many are connected, and how many
need attention. Clicking a cluster switches to it.
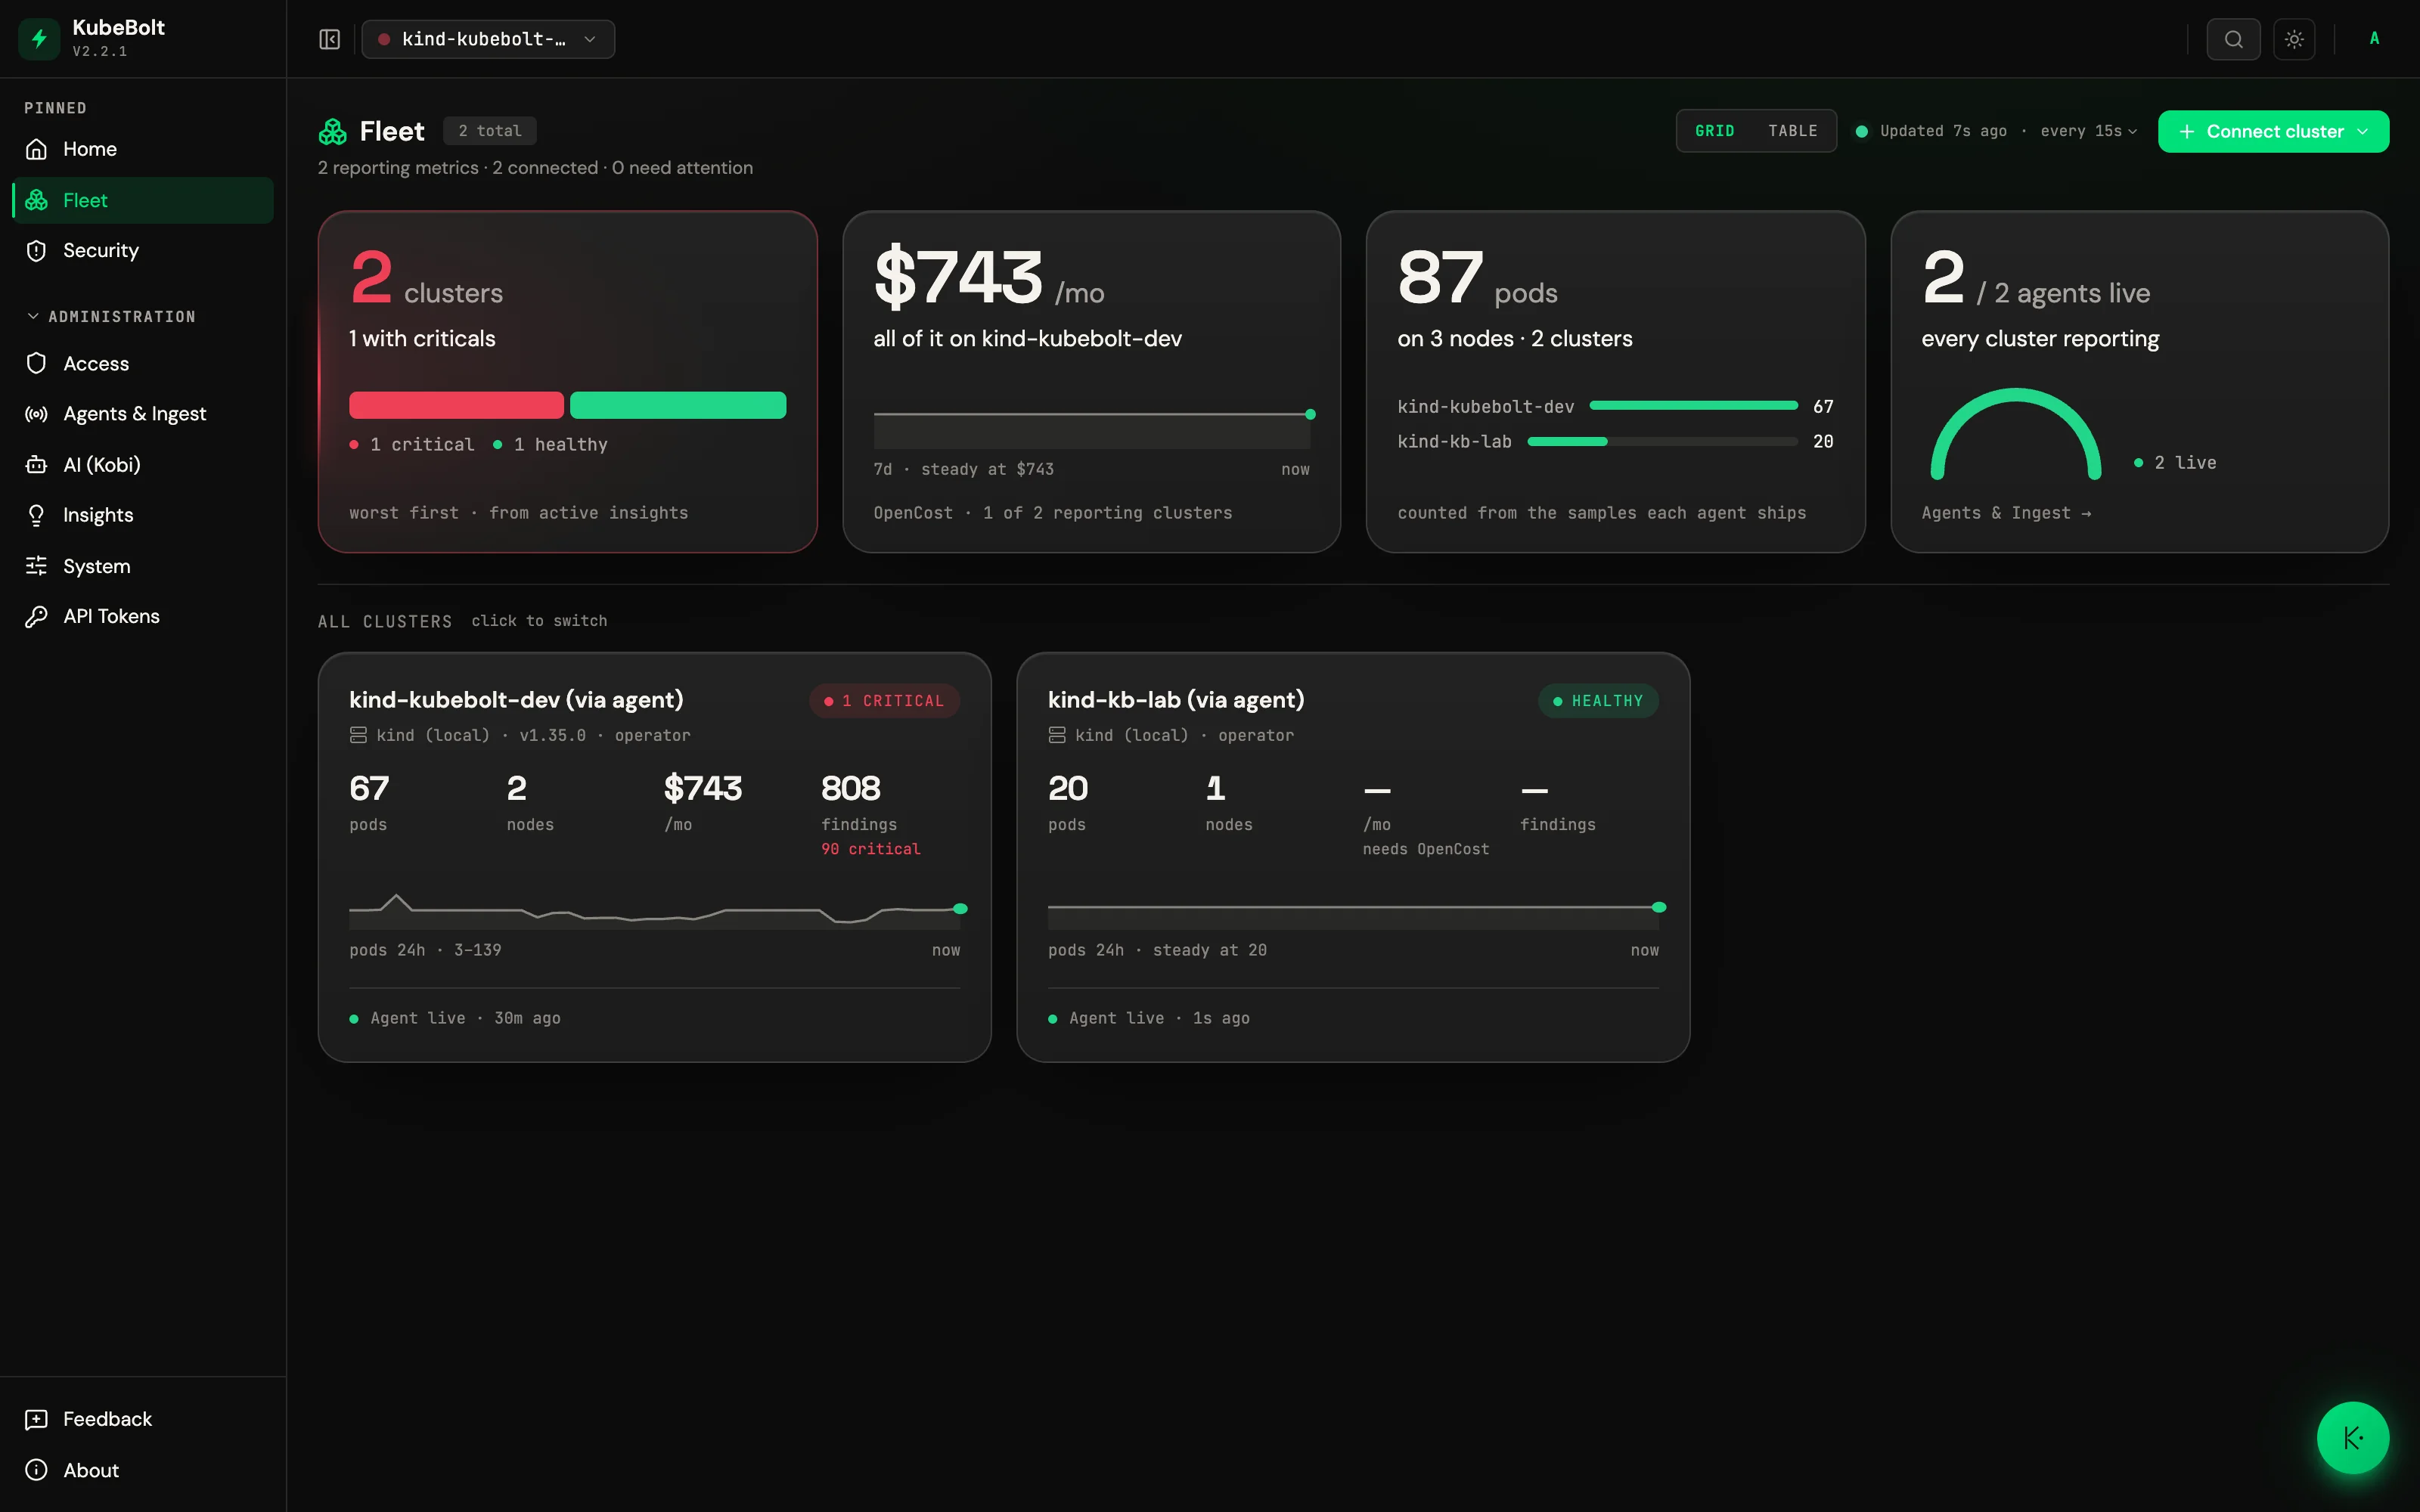
The row above the list describes the fleet’s shape rather than repeating Home’s four numbers:
| Card | What it shows |
|---|---|
| Clusters | One cell per cluster, coloured by its health verdict from active insights, worst first; a cluster not evaluated yet is hatched. Lights red when a cluster has an open critical, amber for warnings |
| Spend | The fleet’s monthly run-rate from OpenCost, its line over the last 7 days, and which cluster carries most of it. Clusters without cost data contribute nothing, and the caption says how many report |
| Pods | Pods across the fleet and the nodes they run on, with one bar per cluster |
| Agents | How many clusters have a live agent channel, with the offline and direct ones called out. Lights amber when an agent-connected cluster’s agent is offline |
Each cluster card carries a pill with its health verdict, its pods, nodes, monthly spend and security findings (critical plus high, with the criticals called out), the pod line for the last 24 hours, and the agent’s state — Agent live · 30m ago, or Agent offline with its last contact. A figure the roll-up can’t answer shows ”—” with the reason under it, such as needs OpenCost for spend, rather than a confident zero. A cluster with no data at all shows a dashed block that says why, and what brings its numbers back: opening it once, the agent reconnecting, or installing the agent.
Fleet spend is a sum over the org, not the active cluster — a cluster that never got cost data wired shows as zero rather than distorting the total.
Cross-cluster search
⌘K (Ctrl+K) opens the search palette anywhere. It has a scope toggle:
- This cluster — the active cluster only.
- All clusters — fans out across every cluster you can see.
The default follows the altitude of the page you are on. Inside a cluster, ⌘K
opens scoped to that cluster. On a global screen — Home, Fleet — it opens
already fanned out, because there is no “this cluster” there to mean anything.
Fleet deliberately has no second in-page search box; this is the one.
Results are grouped by kind, and fleet-scope hits are labelled with the cluster they live in. The footer reports how many clusters were searched.
The same thing over the API:
curl -H "Authorization: Bearer $TOKEN" \
  "https://your-kubebolt/api/v1/search?scope=fleet&q=checkout"
{
"results": [
{ "name": "checkout-api", "namespace": "prod", "kind": "Deployment",
"resourceType": "deployments", "status": "Running", "cluster": "prod-eu" }
],
"clustersSearched": 3
}Without scope=fleet the same endpoint searches the request’s cluster and the
cluster field is absent, so the shape stays backward-compatible.
What the fan-out does and does not do:
- It sweeps 24 resource types by name substring, per cluster.
- Each cluster gets 3 seconds and returns at most 25 hits; the merged result is capped at 50. One slow or hung cluster cannot hold up the rest — it simply contributes nothing.
- It searches the clusters you may see — the same list
GET /clustersreturns. In the open-source edition that is every registered cluster (one organization, no per-team cluster ownership); KubeBolt Cloud narrows it by organization and team. - Minimum three characters.
Related
- Multi-Cluster — the cluster registry and how switching works.
- Connecting clusters — what the wizard generates.
- Remote clusters — exec, port-forward and files over the agent tunnel.